. 2012 Apr 6;287(15):12309-20.
doi: 10.1074/jbc.M111.320465. Epub 2012 Jan 31.

G-protein-coupled receptor kinase interactor-1 (GIT1) is a new endothelial nitric-oxide synthase (eNOS) interactor with functional effects on vascular homeostasis

Affiliations

G-protein-coupled receptor kinase interactor-1 (GIT1) is a new endothelial nitric-oxide synthase (eNOS) interactor with functional effects on vascular homeostasis

Songling Liu et al. J Biol Chem. .

Abstract

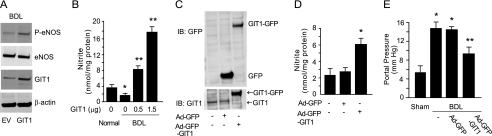
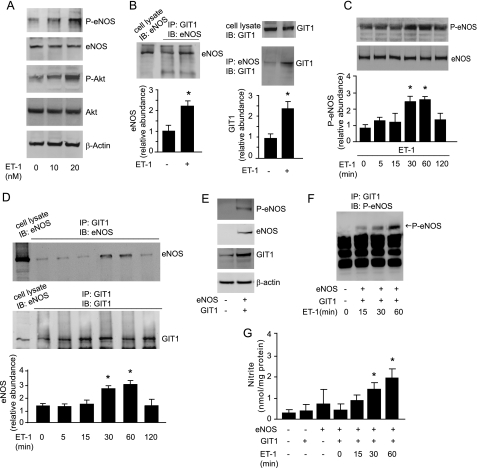
Endothelial cell nitric-oxide (NO) synthase (eNOS), the enzyme responsible for synthesis of NO in the vasculature, undergoes extensive post-translational modifications that modulate its activity. Here we have identified a novel eNOS interactor, G-protein-coupled receptor (GPCR) kinase interactor-1 (GIT1), which plays an unexpected role in GPCR stimulated NO signaling. GIT1 interacted with eNOS in the endothelial cell cytoplasm, and this robust association was associated with stimulatory eNOS phosphorylation (Ser(1177)), enzyme activation, and NO synthesis. GIT1 knockdown had the opposite effect. Additionally, GIT1 expression was reduced in sinusoidal endothelial cells after liver injury, consistent with previously described endothelial dysfunction in this disease. Re-expression of GIT1 after liver injury rescued the endothelial phenotype. These data emphasize the role of GPCR signaling partners in eNOS function and have fundamental implications for vascular disorders involving dysregulated eNOS.


Figures

FIGURE 1.
FIGURE 1.
GIT1 expression and its effect on eNOS activity in normal sinusoidal endothelial cells. A, sinusoidal endothelial cells were transfected with cDNA encoding full-length GIT1 (GIT1, 2 μg) or a cognate empty vector (EV). Phospho-eNOS (Ser1177), total eNOS, and GIT1 were detected in cell lysates by immunoblotting, and representative images are shown. Nitrite was measured in conditioned medium from the same cells and is shown in the right graph (n = 5, *, p < 0.001 for GIT1 transfected cells compared with control). B, GIT1 siRNA at the indicated concentrations was transfected into sinusoidal endothelial cells, and cell lysates were subjected to immunoblotting with the indicated antibodies (upper panels). A scrambled siRNA (Scr) was used as a negative control siRNA. The graph below representative images provides quantitative data for specific bands corresponding to GIT1, normalized to β-actin (n = 3, *, p < 0.05 for GIT1 siRNA compared with no transfection or Scr). Nitrite levels from the same cells are shown in the bottom graph (n = 3, *, p < 0.01 for GIT1 siRNA compared with no transfection or Scr). C, one representative example of 10 others of immunohistochemical localization of eNOS (upper, green) and GIT1 (middle, red) and a merged image (lower) in sinusoidal endothelial cells. The bar is 10 μm in length.
FIGURE 2.
FIGURE 2.
GIT1 and eNOS interact in sinusoidal endothelial cells. A, GIT1 or eNOS from normal sinusoidal endothelial cells was immunoprecipitated (IP) and the presence of associated eNOS (left panel and middle panel) or GIT1 (right panel) protein was assessed by immunoblotting. Immunoprecipitation with IgG as a control and the expression of eNOS and GIT1 from 10% of the total cell lysate used for immunoprecipitation are also shown (left, middle and right panels, respectively). B, cDNA encoding full-length eNOS (1 μg, left panel) or GIT1 (1 μg, right panel) was overexpressed in cells and eNOS or GIT1 were detected in cell lysates by immunoblotting (upper panels); eNOS or GIT1 were immunoprecipitated and the presence of associated of GIT1 (left middle panel) or eNOS (right middle panel) was assessed by immunoblotting (IB). Bands corresponding to GIT1 or eNOS were quantitated, normalized, and shown in the lower graphs (n = 3, *, p < 0.01 for eNOS or GIT1 transfected cells compared with control or EV). C, cells were transfected with GIT1 (1 μg) or GIT1 siRNA (50 nm) and GIT1 from sinusoidal endothelial cells were immunoprecipitated and the presence of associated phospho-eNOS (left panel) or eNOS (right panel) protein was assessed by immunoblotting. Bands corresponding to phospho-eNOS and eNOS were quantified, normalized, and shown in the graphs below the images (n = 3, *, p < 0.01 for GIT1 compared with no transfectants; **, p < 0.05 for GIT1 siRNA compared with no transfectants).
FIGURE 3.
FIGURE 3.
Biochemical features of the GIT1 and eNOS interaction. A, immunoprecipitation (IP) of recombinant GIT1 or eNOS (r-GIT1, 2 μg; r-eNOS, 1 μg) reveals that eNOS binds GIT1 (upper panels) or GIT1 binds eNOS (lower panels). Immunoprecipitation with IgG as a control is also shown (upper left and lower left panels). B, the activity of r-eNOS (2 μg) was examined after incubation without or with r-GIT1 (4 μg) in the presence or absence of l-NAME (1 mm). The activity of r-eNOS alone was arbitrarily set to 100; n = 3, *, p < 0.005, and **, p < 0.001 compared with r-eNOS alone. C, r-eNOS (2 μg) was incubated with vehicle (control) or r-GIT1 (2 μg) in the presence of 10 μm Ca2+ and 100 nm CaM, and eNOS activity was determined as a function of l-arginine concentration (n = 3, *, p < 0.001 and **, p < 0.01 compared with r-eNOS alone). D, r-eNOS (2 μg) was incubated with vehicle (control) or r-GIT1 (2 μg) in the presence or absence of CaM (100 nm), and then NADPH-dependent cytochrome c reductase activity was determined at 23 °C for 3 min (n = 3, *, p < 0.01, and **, p < 0.1 compared with r-eNOS alone). E, GST fusion proteins containing fragments of individual GIT1 domains (4 μg) were incubated with r-eNOS (2 μg) and eNOS activity was measured (note, GST-GIT1 encoding full-length GIT1 is misfolded and insoluble when expressed in E. coli and so was not tested). The activity of eNOS + GST alone was arbitrarily set to 100; n = 3, *, p < 0.05 and **, p < 0.01 compared with eNOS + GST alone. F, schematic diagram showing the GIT1 domains and highlighting specific GIT1 mutations. G, the indicated FLAG-tagged constructs were transfected into normal sinusoidal cells and NOS activity was measured in cell lysates after normalization to control (EV) (n = 3, *, p < 0.01 versus EV). IB, immunoblot.
FIGURE 4.
FIGURE 4.
Liver injury leads to reduced GIT1 expression and interaction with eNOS. A, immunohistochemical localization of GIT1 and eNOS in sinusoidal endothelial cells isolated directly after BDL; eNOS (left, green), GIT1 (middle, red), and a merged image (right) are shown. Representative images of 10 others are shown; the bar is 10 μm in length. B, cell lysates from normal and injured (i.e. BDL) sinusoidal endothelial cells were subjected to immunoblotting (IB) to detect eNOS, GIT1, and/or GIT2 (anti-GIT1 and eNOS antibodies were as described in the legend to Fig. 1; anti-PKL antibody was used to recognize GIT1 and GIT2 simultaneously). Specific bands corresponding to GIT1 were quantitated and presented graphically below representative blots (n = 3, *, p < 0.05 versus normal). C, the interaction of eNOS and GIT1 in normal and BDL sinusoidal endothelial cells was measured by immunoprecipitation (IP) with antibody to GIT1 and immunoblotting with antibody to eNOS. The level of eNOS from 10% of the total cell lysate used for immunoprecipitation is also shown (left lane). Bands corresponding to eNOS were quantitated, normalized to the level of immunoprecipitated GIT1, and presented in the graph shown below the immunoblot (n = 3, *, p < 0.005 for cells from BDL compared with that from normal).
FIGURE 5.
FIGURE 5.
Overexpression of GIT1 in injured liver endothelial cells enhances NO production and ameliorates portal hypertension. A, sinusoidal endothelial cells isolated after BDL were transfected with GIT1 or EV, and cell lysates were subjected to immunoblotting (IB) with the indicated antibodies (representative immunoblots of 3 are shown). B, sinusoidal endothelial cells from BDL were transfected with GIT1 (0.5 to 1.5 μg) and nitrite levels from conditioned medium were measured (n = 3, *, p < 0.01 versus normal; **, p < 0.001 versus BDL not transduced with GIT1). C–E, rats were subjected to BDL, and 4 days later, Ad-GFP or Ad-GFP-GIT1 (1 × 10¹⁰ plaque-forming units/kg) were administered as described under ”Experimental Procedures.“ After 10 additional days, sinusoidal endothelial cells were isolated. C, cell lysates were subjected to immunoblotting with the indicated antibodies, immunoblots representative of 3 others are shown. D, conditioned media from the same cells was collected and nitrite levels were measured (n = 3, *, p < 0.01 versus rats not receiving adenovirus or receiving Ad-GFP alone). E, portal pressure in rats as in C and D was measured as described under ”Experimental Procedures.“ Some rats had sham surgery as under ”Experimental Procedures“ (n = 5, *, p < 0.005 versus sham BDL; **, p < 0.01 versus BDL alone or BDL with Ad-GFP). IP, immunoprecipitation.
FIGURE 6.
FIGURE 6.
Effect of Akt on GIT1/eNOS/NO signaling. A, sinusoidal endothelial cells were isolated from normal rat livers and transfected with cDNA encoding a dominant active Akt (Akt-CA), a dominant-negative Akt (Akt-DN), or an EV, all 1 μg, and nitrite levels were measured in conditioned medium (n = 3, *, p < 0.005 compared with control; **, p < 0.01 compared with control). B, GIT1 was immunoprecipitated (IP) from normal sinusoidal endothelial cell lysates transfected with Akt-CA or EV followed by immunoblotting (IB) to detect either phospho-eNOS or eNOS (representative immunoblots are shown). C, sinusoidal endothelial cells were transfected with Akt-CA, Akt-DN, or EV as in A, and in the upper panel, lysates were immunoblotted to detect eNOS. In the middle panel, lysates were immunoprecipitated with anti-GIT1, then immunoblotted to detect eNOS; specific eNOS bands were quantitated and normalized to the level of immunoprecipitated GIT1 and presented in the graph in the lower panel (n = 3, *, p < 0.05 versus EV or Akt-DN). D, sinusoidal endothelial cells were transfected with Akt-CA or Akt-DN; representative examples (of >10 others) of immunolocalization of eNOS (left, green) and GIT1 (middle, red) in sinusoidal endothelial cells are shown. Merged images after overexpression Akt-CA, Akt-DN, or EV are shown. The bar is 10 μm in length. E, sinusoidal endothelial cells were transfected with GIT1 siRNA (50 nm) and then with adenovirus (multiplicity of infection of 250) encoding constitutively active Akt (Ad-myrAkt) or empty adenovirus without a cDNA insert (left lane in all immunoblots). After 48 h, cell lysates were subjected to immunoblotting with the indicated antibodies. A scrambled siRNA was used as a negative control siRNA (left and middle lanes in all immunoblots). Specific bands corresponding to phospho-eNOS, GIT1, and phospho-Akt were quantitated and presented graphically (n = 3, *, p < 0.05 versus Ad-myrAkt alone, #, p < 0.001 versus empty virus alone).
FIGURE 7.
FIGURE 7.
Agonist stimulation of GIT1 and eNOS interaction. A, sinusoidal endothelial cells were exposed to ET-1 (10 to 20 nm) for 1 h, and cell lysates were subjected to immunoblotting (IB) with the indicated antibodies. B, cells were exposed to ET-1 (10 nm) for 1 h, and cell lysates were subjected to immunoprecipitation (IP) with antibody to GIT1 (left panel) or eNOS (right panel) and immunoblotted with antibody to eNOS or GIT1; specific eNOS or GIT1 bands were quantitated and normalized to the level of immunoprecipitated GIT1 or eNOS and presented in the graph in the lower panel (n = 3, *, p < 0.05 versus no ET-1). The expression of eNOS or GIT1 from 10% of the total cell lysate used for immunoprecipitation is also shown (left panel, left band, and right top panel). C and D, cells were exposed to ET-1 (10 nm) from 0 to 120 min. C, cell lysates were subjected to immunoblotting to detect phospho-eNOS or total eNOS (upper panel); specific phospho-eNOS bands are depicted graphically (lower panel, n = 3, *, p < 0.01 compared with time “0”). D, GIT1 or eNOS from the same cells as in C was immunoprecipitated and the presence of associated eNOS or GIT1 protein was assessed by immunoblotting (upper panel) and specific eNOS bands were quantified and normalized to the level of immunoprecipitated GIT1 (lower panel, n = 3, *, p < 0.05 compared with time 0). In E–G, NIH 3T3 cells were co-transfected with GIT1 or eNOS as indicated. E, cell lysates were subjected to immunoblotting with the indicated antibodies. F and G, NIH 3T3 cells were stimulated with ET-1 for the indicated times, GIT1 was immunoprecipitated and the presence of phospho-eNOS protein was assessed by immunoblotting (F) and conditioned medium was collected and nitrite levels were measured (G, n = 3, *, p < 0.01 compared with no ET-1 or to time 0).
FIGURE 8.
FIGURE 8.
A proposed model of GIT1-mediated eNOS activation in sinusoidal endothelial cells. In normal sinusoidal endothelial cells (left panel), ET-1 activates its cognate G-protein-coupled receptor (ET-B receptor) and activates Gβγ and Gα subunits. This is followed by Gβγ stimulation of Akt (and desensitization of the receptor by GRK2 is not shown). Activated Akt also subsequently facilitates GIT1 binding to eNOS and the direct GIT1-eNOS interaction enhances eNOS activity and NO release. In contrast, in injured sinusoidal endothelial cells (right panel), impaired Akt diminishes the ability of (also reduced levels of) GIT1 to activate eNOS. The ultimate consequence of altered expression and signaling by GIT1 in injured sinusoidal endothelial cells is reduced eNOS activation and NO production.

Similar articles

Cited by

References

    1. Fulton D., Gratton J. P., McCabe T. J., Fontana J., Fujio Y., Walsh K., Franke T. F., Papapetropoulos A., Sessa W. C. (1999) Regulation of endothelium-derived nitric oxide production by the protein kinase Akt. Nature 399, 597–601 - PMC - PubMed
    1. Dimmeler S., Fleming I., Fisslthaler B., Hermann C., Busse R., Zeiher A. M. (1999) Activation of nitric-oxide synthase in endothelial cells by Akt-dependent phosphorylation. Nature 399, 601–605 - PubMed
    1. Busconi L., Michel T. (1993) Endothelial nitric-oxide synthase. N-terminal myristoylation determines subcellular localization. J. Biol. Chem. 268, 8410–8413 - PubMed
    1. García-Cardeña G., Fan R., Stern D. F., Liu J., Sessa W. C. (1996) Endothelial nitric-oxide synthase is regulated by tyrosine phosphorylation and interacts with caveolin-1. J. Biol. Chem. 271, 27237–27240 - PubMed
    1. Cao S., Yao J., McCabe T. J., Yao Q., Katusic Z. S., Sessa W. C., Shah V. (2001) Direct interaction between endothelial nitric-oxide synthase and dynamin-2. Implications for nitric-oxide synthase function. J. Biol. Chem. 276, 14249–14256 - PubMed

Publication types

MeSH terms

LinkOut - more resources