. 2012 Mar 16;287(12):8816-29.
doi: 10.1074/jbc.M111.304758. Epub 2012 Jan 31.

Interleukin-22 is produced by invariant natural killer T lymphocytes during influenza A virus infection: potential role in protection against lung epithelial damages

Affiliations

Interleukin-22 is produced by invariant natural killer T lymphocytes during influenza A virus infection: potential role in protection against lung epithelial damages

Christophe Paget et al. J Biol Chem. .

Abstract

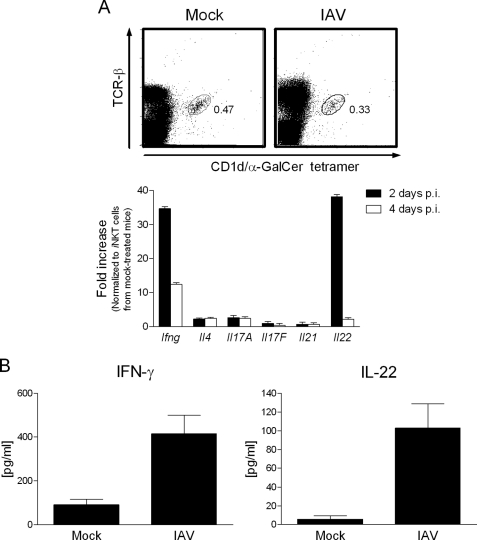
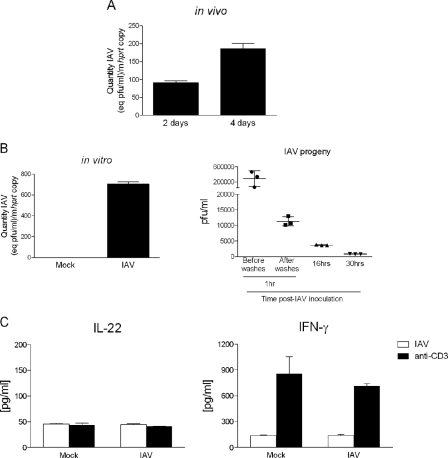
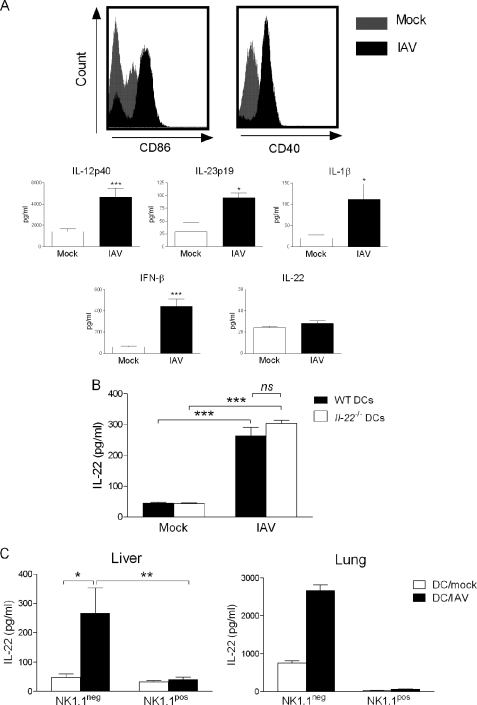
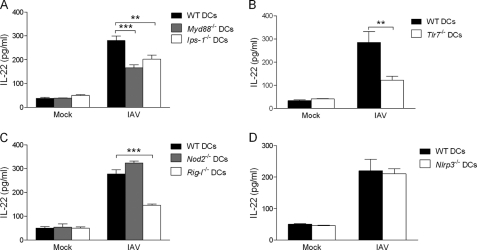
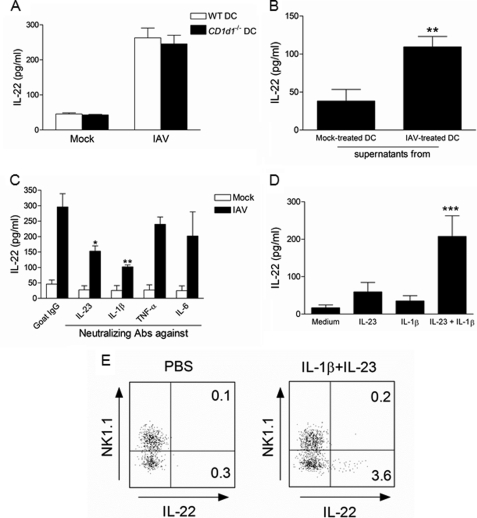
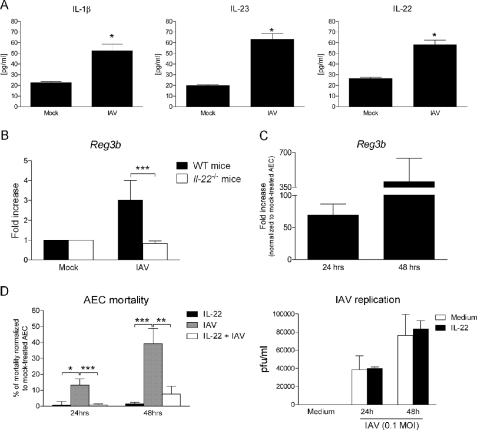
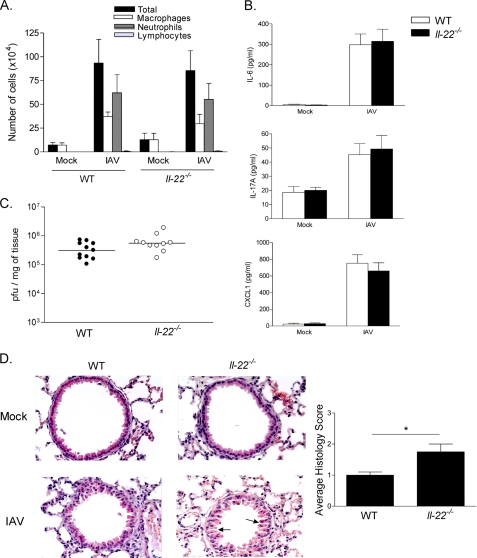
Invariant natural killer T (iNKT) cells are non-conventional lipid-reactive αβ T lymphocytes that play a key role in host responses during viral infections, in particular through the swift production of cytokines. Their beneficial role during experimental influenza A virus (IAV) infection has recently been proposed, although the mechanisms involved remain elusive. Here we show that during in vivo IAV infection, mouse pulmonary iNKT cells produce IFN-γ and IL-22, a Th17-related cytokine critical in mucosal immunity. Although permissive to viral replication, IL-22 production by iNKT cells is not due to IAV infection per se of these cells but is indirectly mediated by IAV-infected dendritic cells (DCs). We show that activation of the viral RNA sensors TLR7 and RIG-I in DCs is important for triggering IL-22 secretion by iNKT cells, whereas the NOD-like receptors NOD2 and NLRP3 are dispensable. Invariant NKT cells respond to IL-1β and IL-23 provided by infected DCs independently of the CD1d molecule to release IL-22. In vitro, IL-22 protects IAV-infected airway epithelial cells against mortality but has no role on viral replication. Finally, during early IAV infection, IL-22 plays a positive role in the control of lung epithelial damages. Overall, IAV infection of DCs activates iNKT cells, providing a rapid source of IL-22 that might be beneficial to preserve the lung epithelium integrity.


Figures

FIGURE 1.
FIGURE 1.
Production of IFN-γ and IL-22 by lung iNKT cells during in vivo IAV infection. A, shown is analysis of cytokine mRNA levels in sorted iNKT cells during IAV infection. Upper panel, iNKT cells were gated on lymphocytes expressing TCR-β and positive for the PBS57-loaded CD1d tetramer (shown are mock-treated and IAV-infected mice, 2 days p.i.). Despite a slight and not significant decrease in iNKT cell frequency, the number of detectable iNKT cells in the lung tissue remained stable 2 and 4 days p.i. Lower panel, invariant NKT cells were purified from the lungs of mock-treated and IAV-infected mice days 2 and 4 p.i. Sorted iNKT cells were analyzed for cytokine mRNA levels (lower panel). RNAs were prepared and IFN-γ (Ifng), IL-4 (Il4), IL-17A (Il17A), IL-17F (Il17F), IL-21 (Il21), and IL-22 (Il22) mRNA copy numbers were measured by quantitative RT-PCR. Data are normalized to expression of Gapdh and are expressed as -fold increase over average gene expression in iNKT cells isolated from mock-treated mice. Genes varying at least 2-fold were considered as significantly modulated. B, production of IFN-γ and IL-22 by iNKT cells sorted from IAV-infected mice is shown. Lung iNKT (PBS57-loaded CD1d tetramer+ TCRβ+) cells were purified from mock-treated or IAV-infected mice (60 h p.i.) and cultured for 2 days without restimulation (1 × 10⁵ cells/well). Cytokines present in the supernatant were quantified by ELISA. A and B, data represent the mean ± S.D. (triplicates) of an experiment of two performed (pool of 10 mice/group).
FIGURE 2.
FIGURE 2.
Analysis of iNKT cell activation in response to IAV infection. A, shown is analysis of IAV mRNA in sorted iNKT cells during IAV infection (panel A) or in iNKT cells exposed in vitro with IAV (m.o.i. = 1) (panel B, left panel). M2 IAV mRNA levels were measured by quantitative RT-PCR. Data are normalized to expression of hprt. Shown are IAV M2/hprt mRNA expression ratios from iNKT (PBS57-loaded CD1d tetramer+ TCRβ+) cells sorted from the lungs of infected mice at days 2 and 4 p.i. (panel A) and from iNKT cells sorted from the liver of naive animals and exposed for 24 h with IAV (panel B, left panel). B, right panel, the viral titer in iNKT cell supernatants was determined by plaque assay at different time points after IAV exposure. pfu, plaque-forming units. C, purified iNKT cells were exposed to IAV (m.o.i. = 1), and 48 h later, cytokines present in the supernatant were quantified by ELISA. A–C, data represent the mean ± S.D. (triplicates) of an experiment of two (panel A) or three (panels B and C) performed.
FIGURE 3.
FIGURE 3.
Analysis of iNKT activation in response to IAV-infected DCs. A, effects of IAV infection on the surface expression of co-stimulatory molecules and on the release of cytokines on/by DCs are shown. Upper panel, bone marrow-derived DCs (CD11c+ MHC class+, ∼97% pure) were exposed or not to IAV (m.o.i. = 1) for 16 h. Afterward DCs were stained with the anti-CD86 or CD40 Abs and analyzed by flow cytometry. Lower panel, 24 h after stimulation, cytokine concentrations in culture supernatants were determined by ELISA. Data represent the mean ± S.E. of at least five independent experiments performed in triplicates. B, shown is the effect of IAV-infected DCs on cytokine release by iNKT cells. WT or Il-22−/− DCs were exposed or not to IAV (m.o.i. = 1) for 16 h and after extensive washing were co-cultured with sorted liver PBS57-loaded CD1d tetramer+ TCRβ+ cells. n.s., not significant. C, the same experiment was performed, but in this case, liver (left panel) or lung (right panel) iNKT cells were discriminated on the basis of NK1.1 expression. B and C, left panel, cytokine release was quantified 48 h later. Data represent the mean ± S.E. of at least three independent experiments performed in triplicate. A one-way ANOVA has been used to analyze the variance followed by a Bonferroni multiple comparison test to compare all groups. *, p < 0.05; **, p < 0.01; ***, p < 0.001. C, right panel, one representative experiment of two is shown (mean ± S.D., duplicate).
FIGURE 4.
FIGURE 4.
Role of innate sensors in IL-22 release by iNKT cells. WT, Myd88−/− and Ips-1−/− (panel A), WT and Tlr7−/− (panel B), WT, Nod2−/−, and Rig-I−/− (panel C), or WT and Nlrp3−/− (panel D) DCs were exposed or not (mock) to IAV (m.o.i. = 1) for 16 h, extensively washed, and co-cultured for 48 h with purified liver iNKT cells. Cytokine production was quantified by ELISA. Data represent the mean ± S.E. of at least three independent experiments performed in triplicate. A–C, a one-way ANOVA has been used to analyze the variance followed by a Bonferroni multiple comparison test to compare all groups. **, p < 0.01; ***, p < 0.001. B–D, differences in mean were analyzed using the two-tailed Student's t tests. **, p < 0.01.
FIGURE 5.
FIGURE 5.
Mechanisms involved in IAV-induced IL-22 release by NK1.1neg iNKT cells. A, IAV-infected WT or CD1d1−/− DCs were cultured with sorted liver iNKT cells. Of note, in response to the canonical iNKT cell agonist α-galactosylceramide, CD1d deficiency in DC fully abrogated IFN-γ production by iNKT cells (data not shown). B, after 16 h, undiluted supernatant from mock-treated or IAV-infected DCs was added to iNKT cells. C, IAV-infected DCs were cultured with iNKT cells in the presence of neutralizing anti-IL-23, anti-IL-1β, anti-TNF-α, anti-IL-6, or isotype control mAbs (5 μg/ml). D, purified iNKT cells were incubated with recombinant IL-23 and/or IL1-β protein(s) (1 ng/ml). Of note, TNF-α and IL-6 were without effect on IL-22 release (data not shown). A–D, two days later, IL-22 production was measured by ELISA. Data represent the mean ± S.D. of at least three independent experiments performed in triplicate. B, differences in mean were analyzed using the two-tailed Student's t test. **, p < 0.01. C and D, a one-way ANOVA was used to analyze the variance followed by a Bonferroni multiple comparison test to compare all groups. *, p < 0.05; **, p < 0.01; ***, p < 0.001. E, shown is intracellular staining of IL-22 in lung iNKT cells. Lung mononuclear cells treated with IL-1β and IL-23 (10 ng/ml) for 4 h in the presence of brefeldin A and gated iNKT cells expressing or not the NK1.1 marker were analyzed for intracellular IL-22 production. Gates were set based on the isotype control. The percentage of iNKT cells expressing IL-22 is shown. One representative experiment of two is depicted.
FIGURE 6.
FIGURE 6.
Effect of IL-22 on the mortality of IAV-infected airway epithelial cells. A, BAL fluids from mock-treated or IAV-infected (2 days p.i.) mice were harvested, and IL1-β, IL-23, and IL-22 concentrations were quantified by ELISA. Data represent the mean ± S.E. of a representative experiment (4 mice/group) of four performed. Differences in mean were analyzed using the two-tailed Student's t test. *, p < 0.05. B, RNAs from whole lungs recovered from mock-treated or IAV-infected (4 days p.i.) mice were harvested, and REG3β (Reg3b) mRNA copy numbers were measured by quantitative RT-PCR. Data are normalized to expression of Gapdh and are expressed as -fold increase over average gene expression in lung tissue from mock-treated mice. Data represent the mean ± S.D. of a representative experiment (four mice/group) of two performed. A one-way ANOVA was used to analyze the variance followed by a Bonferroni multiple comparison test to compare all groups. ***, p < 0.001. C, AEC were cultured for 16 h with recombinant IL-22 (100 ng/ml), and cells were then analyzed for REG3β mRNA level. Data are normalized to expression of Gapdh and are expressed as -fold increase over average gene expression in untreated AEC. Data represent the mean ± S.D. of three independent experiments (triplicate). D, AEC, treated or not with IL-22, were exposed or not to IAV (m.o.i. = 1), and 24 and 48 h later, cell mortality was quantified using Resorufin (left panel). The viral titer in AEC supernatants was determined by plaque assay (right panel). Data represent the mean ± S.D. of four independent experiments (left panel) or represent an experiment of four performed (right panel). A one-way ANOVA was used to analyze the variance followed by a Bonferroni multiple comparison test to compare all groups. *, p < 0.05; **, p < 0.01; ***, p < 0.001.
FIGURE 7.
FIGURE 7.
Effect of IL-22 deficiency on IAV-associated epithelial damage in vivo. Age-matched WT or Il-22−/− mice were infected with 100 plaque-forming units of IAV Scotland/20/74/H3N2 strain and then sacrificed 4 days p.i. A, total cells, neutrophils, macrophages, and lymphocytes in the BALs were counted. B, IL-6, IL-17A, and CXCL1 concentrations in BAL fluids were quantified by ELISA. C, the viral loads, expressed as plaque forming units (pfu)/mg of lung tissue, were determined by plaque assay. D, representative hematoxylin and eosin-stained tissue sections (magnification × 400) are shown. Sections were scored blindly for levels of epithelial hyperplasia and loss of intercellular cohesion (arrows). Results are representative of three repeated experiments. Data represent the mean ± S.D. (n = 5–11 mice/group). Significant differences are designated by an asterisk (*, p < 0.05 (two-tailed Student's t test).

References

    1. Bendelac A., Savage P. B., Teyton L. (2007) The biology of NKT cells. Annu. Rev. Immunol. 25, 297–336 - PubMed
    1. Kronenberg M. (2005) Toward an understanding of NKT cell biology. Progress and paradoxes. Annu. Rev. Immunol. 23, 877–900 - PubMed
    1. Godfrey D. I., Kronenberg M. (2004) Going both ways. Immune regulation via CD1d-dependent NKT cells. J. Clin. Invest. 114, 1379–1388 - PMC - PubMed
    1. Van Kaer L., Joyce S. (2005) Innate immunity. NKT cells in the spotlight. Curr. Biol. 15, R429–R431 - PubMed
    1. Kawano T., Cui J., Koezuka Y., Toura I., Kaneko Y., Motoki K., Ueno H., Nakagawa R., Sato H., Kondo E., Koseki H., Taniguchi M. (1997) CD1d-restricted and TCR-mediated activation of vα14 NKT cells by glycosylceramides. Science 278, 1626–1629 - PubMed

Publication types