

Signal-to-noise ratio increase in carotid atheroma MRI: a comparison of 1.5 and 3 T
- PMID: 22294703
- PMCID: PMC3474060
- DOI: 10.1259/bjr/70496948
Signal-to-noise ratio increase in carotid atheroma MRI: a comparison of 1.5 and 3 T
Abstract
Objectives: This study reports quantitative comparisons of signal-to-noise ratio (SNR) at 1.5 and 3 T from images of carotid atheroma obtained using a multicontrast, cardiac-gated, blood-suppressed fast spin echo protocol.
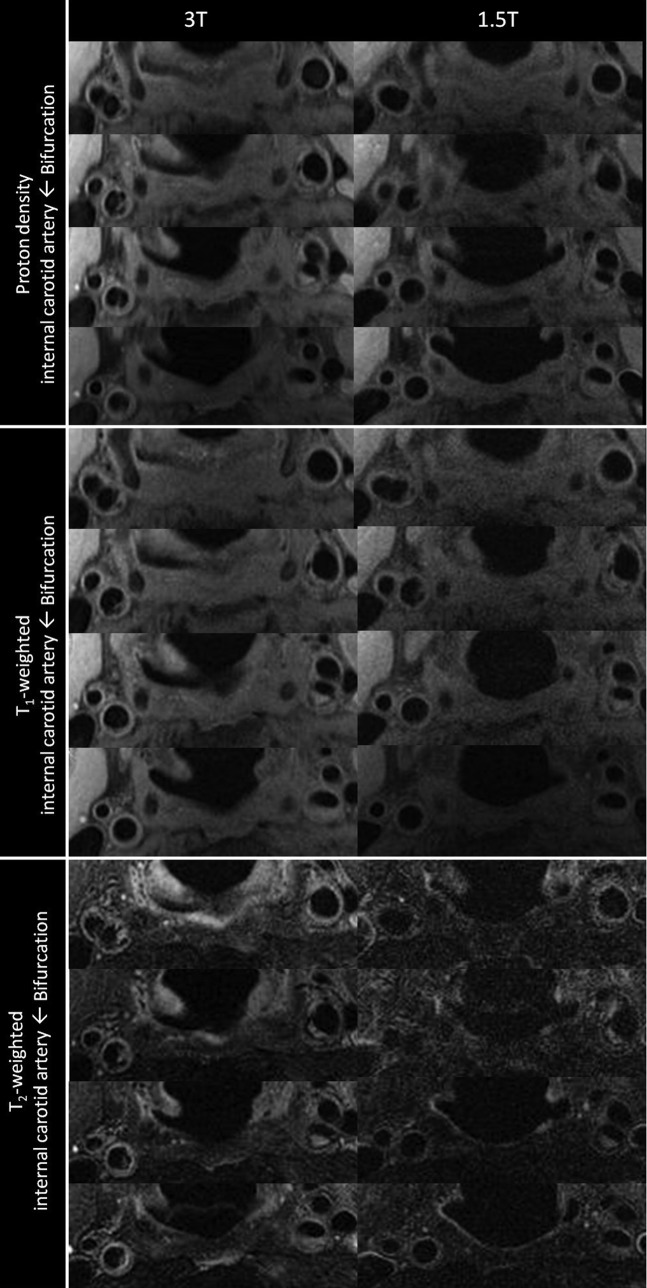
Methods: 18 subjects, with carotid atherosclerosis (>30% stenosis) confirmed on ultrasound, were imaged on both 1.5 and 3 T systems using phased-array coils with matched hardware specifications. T(1) weighted (T(1)W), T(2) weighted (T(2)W) and proton density-weighted (PDW) images were acquired with identical scan times. Multiple slices were prescribed to encompass both the carotid bifurcation and the plaque. Image quality was quantified using the SNR and contrast-to-noise ratio (CNR). A phantom experiment was also performed to validate the SNR method and confirm the size of the improvement in SNR. Comparisons of the SNR values from the vessel wall with muscle and plaque/lumen CNR measurements were performed at a patient level. To account for the multiple comparisons a Bonferroni correction was applied.
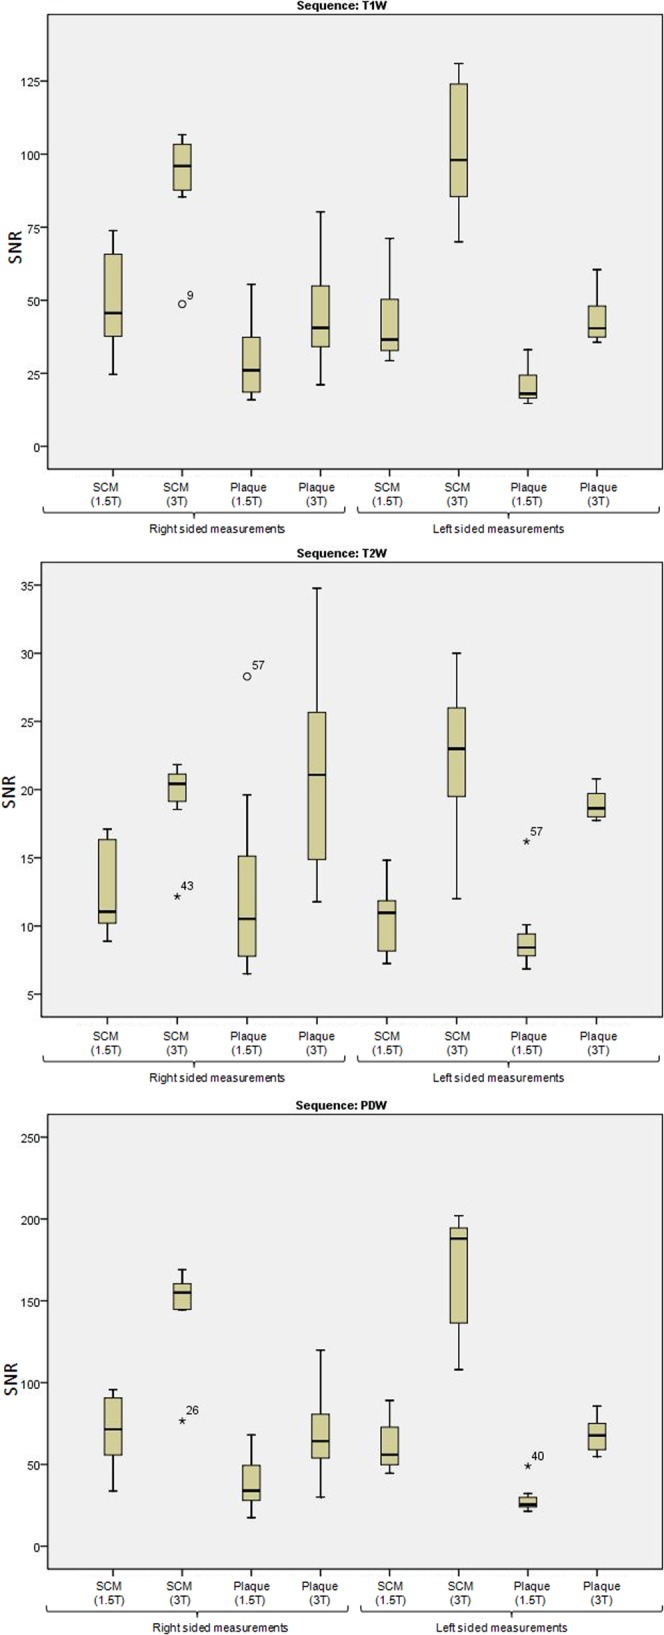
Results: One subject was excluded from the protocol owing to image quality and protocol failure. The mean improvement in SNR in plaque was 1.9, 2.1 and 2.1 in T(1)W, T(2)W and PDW images, respectively. All plaque SNR improvements were statistically significant at the p<0.05 level. The phantom experiment reported an improvement in SNR of 2.4 for PDW images.
Conclusions: Significant gains in SNR can be obtained for carotid atheroma imaging at 3 T compared with 1.5 T. There was also a trend towards increased CNR. However, this was not significant after the application of the Bonferroni correction.
Figures
References
-
- Toussaint JF, LaMuraglia GM, Southern JF, Fuster V, Kantor HL. Magnetic resonance images lipid, fibrous, calcified, hemorrhagic, and thrombotic components of human atherosclerosis in vivo. Circulation 1996;94:932–8 - PubMed
-
- Cai JM, Hatsukami TS, Ferguson MS, Small R, Polissar NL, Yuan C. Classification of human carotid atherosclerotic lesions with in vivo multicontrast magnetic resonance imaging. Circulation 2002;106:1368–73 - PubMed
-
- Hatsukami TS, Ross R, Polissar NL, Yuan C. Visualization of fibrous cap thickness and rupture in human atherosclerotic carotid plaque in vivo with high-resolution magnetic resonance imaging. Circulation 2000;102:959–64 - PubMed
-
- Mitsumori LM, Hatsukami TS, Ferguson MS, Kerwin WS, Cai J, Yuan C. In vivo accuracy of multisequence MR imaging for identifying unstable fibrous caps in advanced human carotid plaques. J Magn Reson Imaging 2003;17:410–20 - PubMed
Publication types
MeSH terms
LinkOut - more resources
Full Text Sources
Medical
