

doi: 10.1161/CIRCULATIONAHA.111.089243.
Personalized cardiovascular medicine and drug development: time for a new paradigm
Affiliations
- PMID: 22294708
- PMCID: PMC3273851
- DOI: 10.1161/CIRCULATIONAHA.111.089243
Item in Clipboard
Personalized cardiovascular medicine and drug development: time for a new paradigm
Circulation.
.
No abstract available
Figures
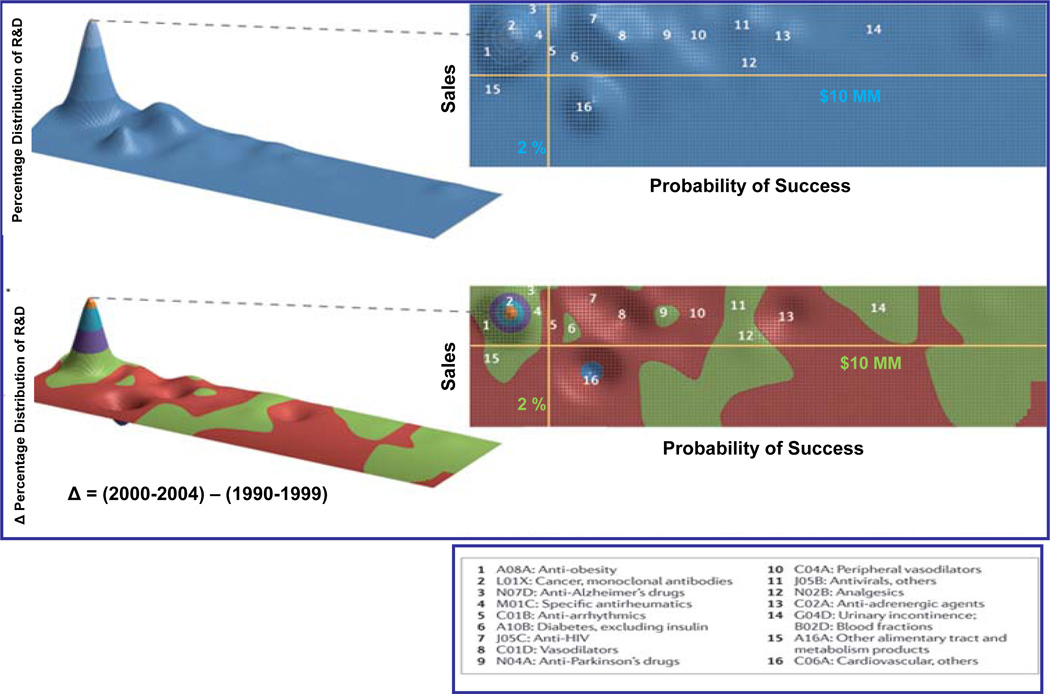
The probability of success is shown on the x-axis and logarithm of the (potential) sales is shown on the y-axis in each plot. Reference lines (in yellow) are given for 2% probability of success and $10 million average annual sales in the US. In the upper plot, the percentage distribution of research and development projects is shown on the z-axis. In the lower plot, the change in percentage distribution of research and development projects from 2000 onward. The key indicates the specific areas of pharmaceutical research and development by drug class, numerically indicated on the plots. (Reproduced with modification from reference , with permission).
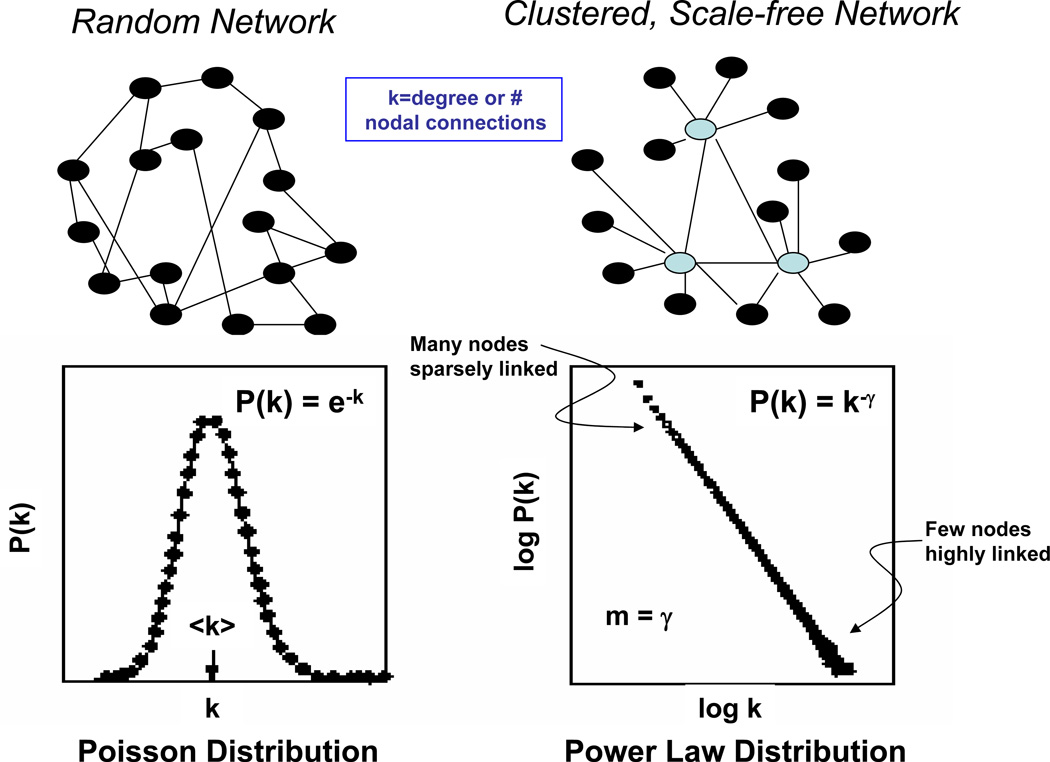
All networks can be represented as a collections of nodes (shown as circles) and links (shown as lines). Highly connected nodes, or hubs, are shown as blue circles in the network. The degree of the network, or the number of nodal connections, is given as k. On the right, a random network of nodes and links is depicted, with its Poisson distribution shown in the accompanying graph. On the left, a scale-free, clustered network of nodes and links is depicted, with its power law distribution shown in the accompanying graph; the slope of the line (m) is given by the exponent, γ.
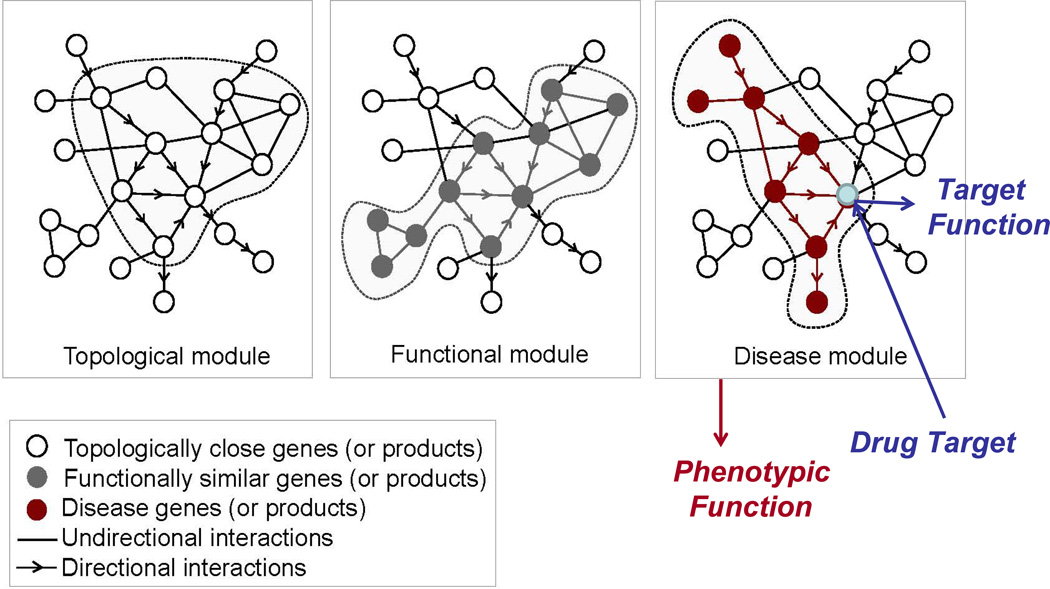
A theoretical network of interacting nodes is illustrated in each panel, and distinctive modules within the network highlighted. On the left, a topological module that corresponds to locally associated nodes within the ‘interactome’ is circled. In the middle panel, a functional module in which there is a segregation of nodes of related function is shown in grey. In the right panel, a disease module associated with a disease phenotype is shown in red; note that the disease module is neither part of the topological or functional module in this network. A potential drug target is shown in blue, with target function (as assayed in conventional target-based drug development) distinguished from phenotypic function (as assayed in phenotype-based drug development). (Reproduced with modification from reference , with permission).
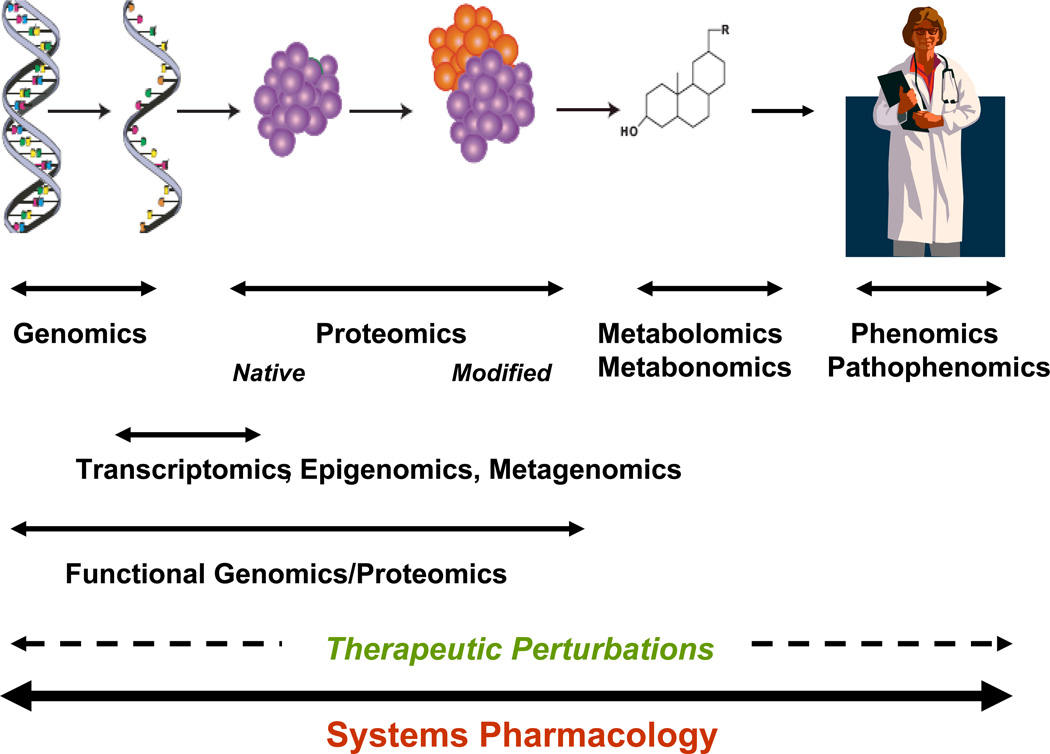
The associations from genome to phenome, and in the case of disease, the pathophenome are shown, with underlying transcriptomic, epigenomic, and metagenomic modification. Drug action is indicated as a therapeutic perturbation to the system. (Reproduced with modification from reference , with permission).
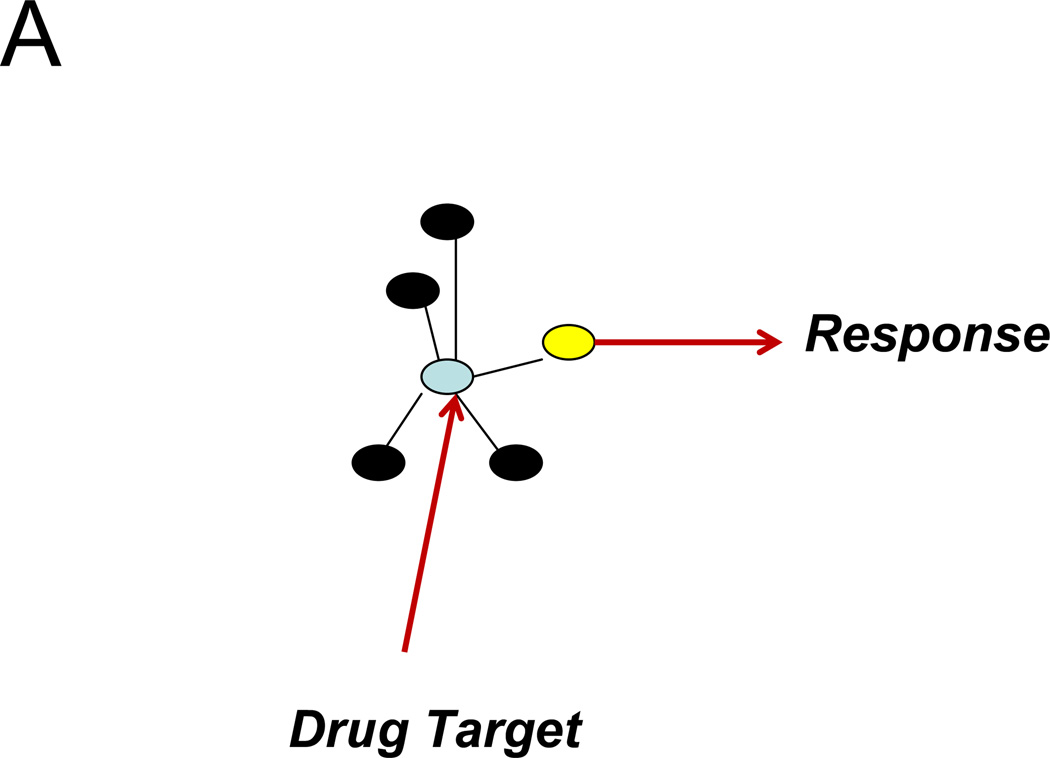
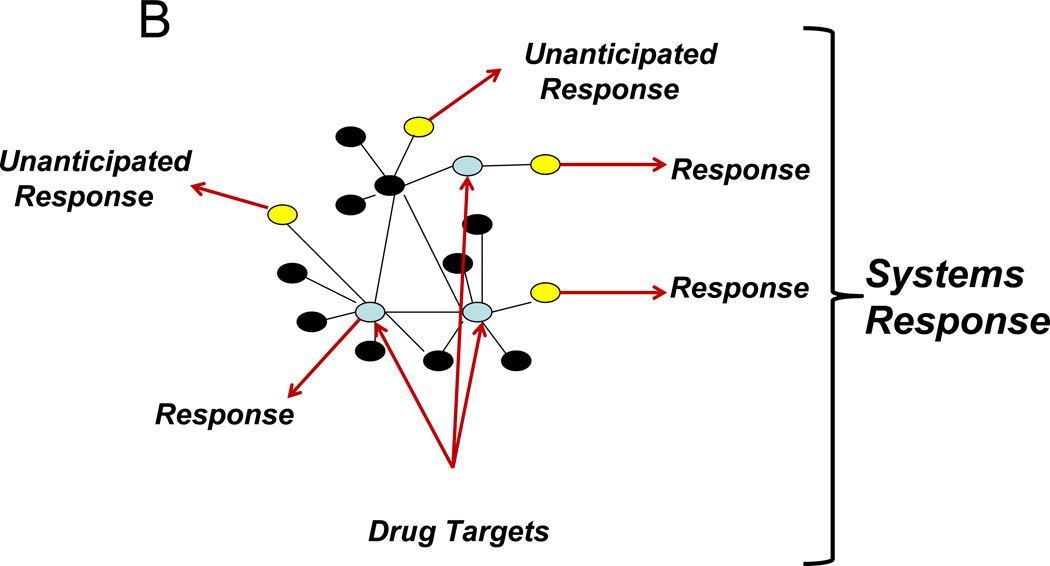
A) A drug target, in blue, is monitored with a single response (target-based drug action). B) Three drug targets in a network respond uniquely to the drug, with the systems response reflecting the composite action of the drug on the entire network (phenotype-based drug action).
A) A drug target, in blue, is monitored with a single response (target-based drug action). B) Three drug targets in a network respond uniquely to the drug, with the systems response reflecting the composite action of the drug on the entire network (phenotype-based drug action).
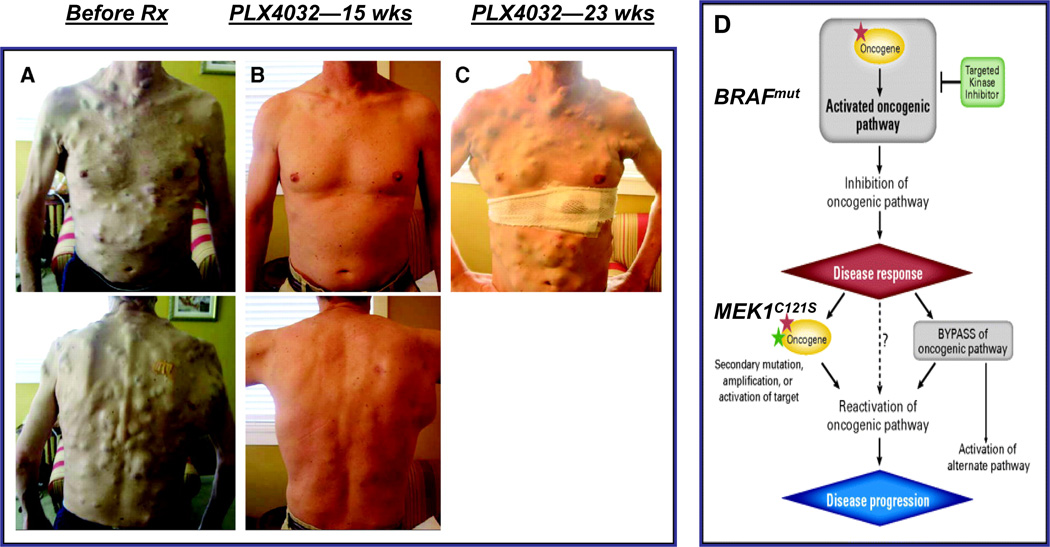
A) Before initiation of treatment, B) after 15 weeks of treatment, and C) after 23 weeks of treatment with relapse. D) Mechanism of drug resistance in kinase-dependent oncogene pathway, with mutation developing downstream of BRAF, in MEK, leading to recurrence of tumor. (Reproduced with modification from reference , with permission).
(Reproduced with modification from reference , with permission).
References
-
- Weiss S. Routine Practices: Medical Service of the Peter Bent Brigham Hospital. Self-published; Boston: 1940. pp. 143–145.
-
- Ridley M. Drugs That Are as Smart as Our Diseases. The Wall Street Journal. 2011 September 17;
-
- Pammolli F, Magazzini L, Riccaboni M. The productivity crisis in pharmaceutical R&D. Nat. Rev. Drug Disc. 2011;10:428–438. - PubMed
-
- Swinney DC, Anthony J. How were new medicines discovered? Nat. Rev. Drug Disc. 2011;10:507–519. - PubMed
-
- Loscalzo J. Homocysteine trials—clear outcomes for complex reasons. N. Engl. J. Med. 2006;354:1629–1632. - PubMed
Publication types
MeSH terms
Grants and funding
LinkOut - more resources
Full Text Sources
Medical
