

Vitamin D concentrations among healthy children in Calgary, Alberta
- PMID: 22294867
- PMCID: PMC3043039
- DOI: 10.1093/pch/16.2.82
Vitamin D concentrations among healthy children in Calgary, Alberta
Abstract
Objective: To examine the relationship between serum vitamin D concentrations, dietary intake and body mass index among healthy children living in Calgary, Alberta.
Methods: The present cross-sectional study included healthy children two to 13 years of age who presented to the Alberta Children's Hospital for elective surgery during a 12-month period. Data including the child's weight, height, age, sex, ethnicity, dietary intake, use of vitamin supplements, physical activity and time spent outdoors were collected. Serum concentrations of 25-hydroxyvitamin D (25[OH]D) were measured using commercial immunoradiometric assay kits.
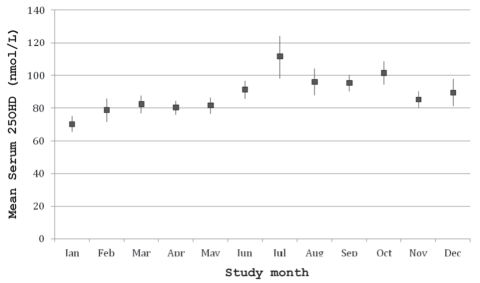
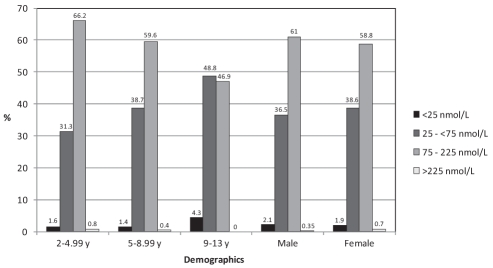
Results: Serum 25(OH)D concentrations were available for 1442 of 1862 participants, of whom 862 (59.8%) were boys. The mean (± SD) serum 25(OH)D concentration was 86.1±35.1 nmol/L (range 10 nmol/L to 323 nmol/L). Five hundred thirty-nine (37.4%) participants had insufficient vitamin D status (25[OH]D between 25 nmol/L and lower than 75 nmol/L), and vitamin D deficiency (25[OH]D 25 nmol/L or lower) was present in 29 subjects (2.0%). Children in the older age group (nine to 13 years) were more likely to have suboptimal vitamin D (P<0.001). Other risk factors significantly associated with suboptimal vitamin D status included overweight or obesity, nonwhite ethnicity, winter months, dietary vitamin D intake of less than 200 IU/day and less time spent outdoors.
Conclusion: A high rate of suboptimal vitamin D concentrations was observed among the participants. Beyond promoting a vitamin D-enriched diet, physicians should also consider the body mass index and other risk factors to determine the optimal vitamin D intake for children living in the area studied.
OBJECTIF :: Examiner le lien entre les concentrations sériques de vitamine D, la consommation alimentaire et l’indice de masse corporelle chez des enfants en santé de Calgary, en Alberta.
MÉTHODOLOGIE :: La présente étude transversale portait sur les enfants en santé de deux à 13 ans qui se sont présentés à l’Alberta Children’s Hospital afin de subir une opération non urgente sur une période de 12 mois. Les chercheurs ont colligé les données suivantes : le poids, la taille, l’âge, le sexe, l’ethnie, l’apport alimentaire, la prise de suppléments de vitamines, l’activité physique et le temps passé à l’extérieur. Ils ont mesuré les concentrations sériques de 25-hydroxyvitamine D (25[OH]D) au moyen de dosages immunométriques commerciaux.
RÉSULTATS :: On connaissait les concentrations sériques de 25(OH)D chez 1 442 des 1 862 participants, dont 862 (59,8 %) étaient des garçons. La concentration sérique moyenne (±ÉT) de 25(OH)D était de 86,1±35,1 nmol/L (plage de 10 nmol/L à 323 nmol/L). Cinq cent trente-neuf (37,4 %) participants avaient un taux de vitamine D insuffisant (25[OH]D de 25 nmol/L et de moins de 75 nmol/L), et 29 (2,0 %), une carence en vitamine D (25[OH]D de 25 nmol/L ou moins). Les enfants du groupe plus âgé (neuf à 13 ans) étaient plus susceptibles d’avoir une concentration sous-optimale de vitamine D (P<0,001). D’autres facteurs de risque s’associaient de manière significative à un taux sous-optimal de vitamine D, soit l’embonpoint ou l’obésité, l’ethnie non blanche, les mois d’hiver, un apport alimentaire de vitamine D inférieur à 200 UI/jour et moins de temps passé à l’extérieur.
CONCLUSION :: Les chercheurs ont observé un taux élevé de concentrations sous-optimales de vitamine D chez les participants. À part promouvoir un régime enrichi de vitamine D, les médecins devraient également tenir compte de l’indice de masse corporelle et d’autres facteurs de risque pour déterminer l’apport de vitamine D optimal chez les enfants qui vivent dans la région à l’étude.
Keywords: BMI; Healthy children; Nutrition; Vitamin D.
Figures
References
-
- Gordon CM, DePeter KC, Feldman HA, Grace E, Emans J. Prevalence of vitamin D deficiency among healthy adolescents. Arch Pediatr Adolesc Med. 2004;158:531–7. - PubMed
-
- Holick MF. Vitamin D deficiency. N Engl J Med. 2007;357:266–81. - PubMed
-
- Heaney RP. Functional indices of vitamin D status and ramifications of vitamin D deficiency. Am J Clin Nutr. 2004;80(Suppl):1706S–9S. - PubMed
LinkOut - more resources
Full Text Sources