

Optical fiber sensing based on reflection laser spectroscopy
- PMID: 22294902
- PMCID: PMC3264454
- DOI: 10.3390/s100301823
Optical fiber sensing based on reflection laser spectroscopy
Abstract
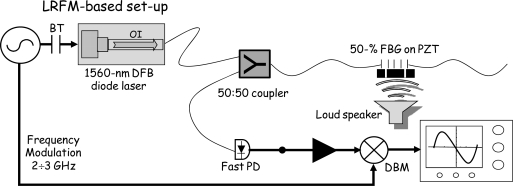
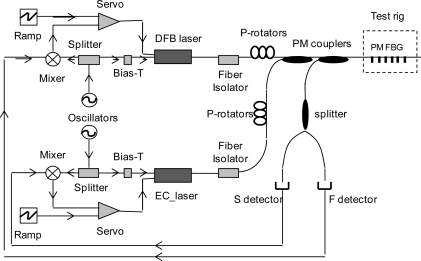
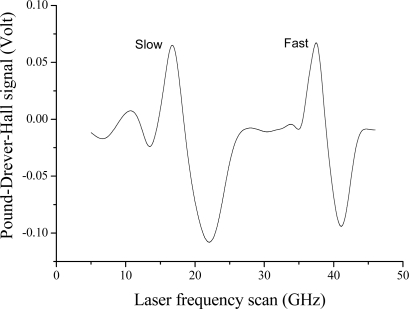
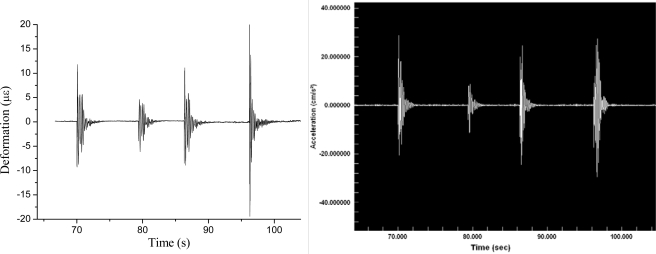
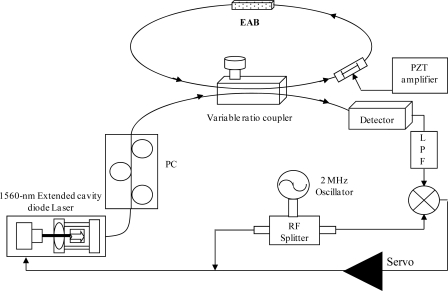
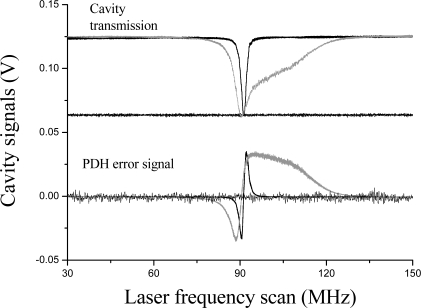
An overview on high-resolution and fast interrogation of optical-fiber sensors relying on laser reflection spectroscopy is given. Fiber Bragg-gratings (FBGs) and FBG resonators built in fibers of different types are used for strain, temperature and acceleration measurements using heterodyne-detection and optical frequency-locking techniques. Silica fiber-ring cavities are used for chemical sensing based on evanescent-wave spectroscopy. Various arrangements for signal recovery and noise reduction, as an extension of most typical spectroscopic techniques, are illustrated and results on detection performances are presented.
Keywords: Fiber Bragg gratings; Pound-Drever-Hall method; fiber resonator; frequency locking; high-birefringence fiber; laser-frequency modulation.
Figures

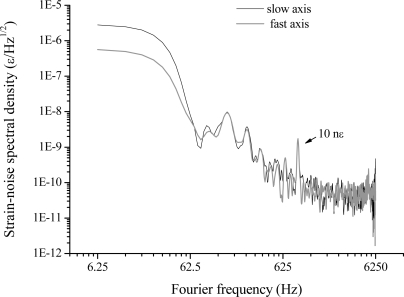
 (grey), Fast and ▴ (black), Slow axes.
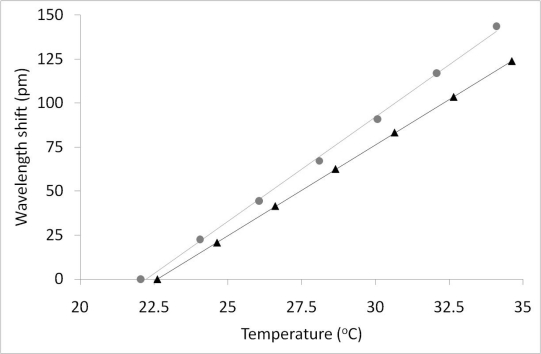 (grey), Fast and ▴ (black), Slow axes.


References
-
- Kersey A.D. A Review of Recent Developments in Fiber Optic Sensor Technology. Opt. Fiber Technol. 1996;2:291–317.
-
- Yu F.T.S., Yin S., editors. In Fiber Optic Sensors. Marcel Dekker, Inc; New York, NY, USA: 2002. p. 449.
-
- Rao Y.J. In-Fibre Bragg Grating Sensors. Meas. Sci. Technol. 1997;8:355–375.
-
- Xu M.G., Geiger H., Dakin J.P. Interrogation of Fiberoptic in Interferometric Sensors Using Acoustooptic Tunable Filter. Electron. Lett. 1995;31:1487–1488.
-
- Lissak B., Arie A., Tur M. Highly Sensitive Dynamic Strain Measurements by Locking Lasers to Fiber Bragg Gratings. Opt. Lett. 1998;23:1930–1932. - PubMed
Publication types
MeSH terms
LinkOut - more resources
Full Text Sources
