. 2012;7(1):e30324.
doi: 10.1371/journal.pone.0030324. Epub 2012 Jan 25.

Highly accurate diagnosis of pleural tuberculosis by immunological analysis of the pleural effusion

Affiliations

Highly accurate diagnosis of pleural tuberculosis by immunological analysis of the pleural effusion

Jayne S Sutherland et al. PLoS One. 2012.

Abstract

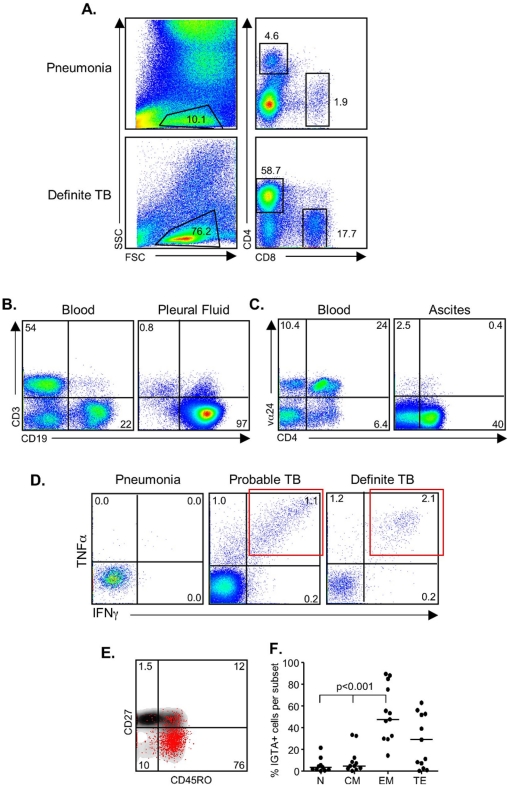
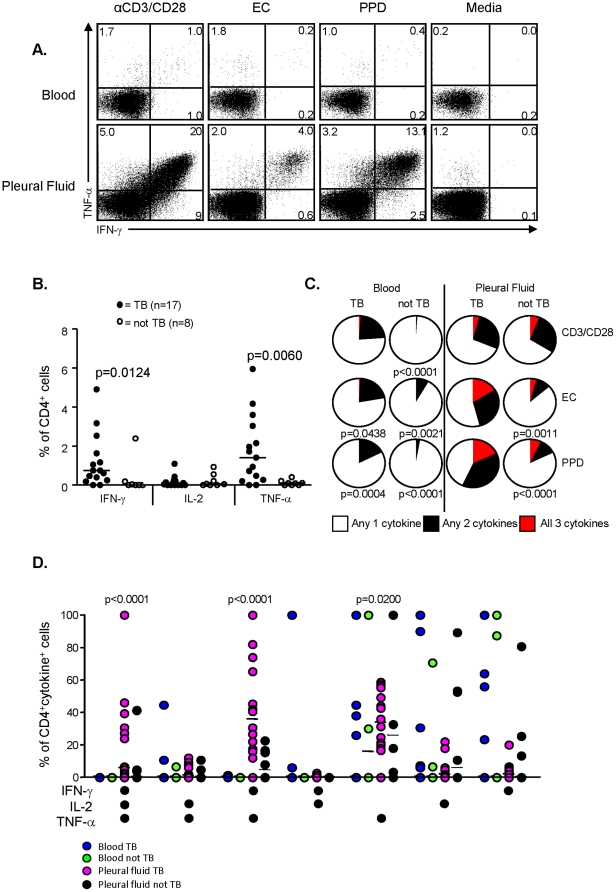
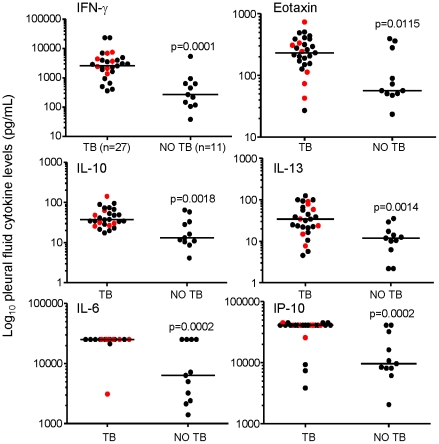
Pleural TB is notoriously difficult to diagnose due to its paucibacillary nature yet it is the most common cause of pleural effusions in TB endemic countries such as The Gambia. We identified both cellular and soluble biomarkers in the pleural fluid that allowed highly accurate diagnosis of pleural TB compared to peripheral blood markers. Multi-plex cytokine analysis on unstimulated pleural fluid showed that IP-10 resulted in a positive likelihood ratio (LR) of 9.6 versus 2.8 for IFN-γ; a combination of IP-10, IL-6 and IL-10 resulted in an AUC of 0.96 and positive LR of 10. A striking finding was the significantly higher proportion of PPD-specific IFN-γ+TNF-α+ cell population (PPD-IGTA) in the pleural fluid compared to peripheral blood of TB subjects. Presence of this pleural PPD-IGTA population resulted in 95% correct classification of pleural TB disease with a sensitivity of 95% and specificity of 100%. These data suggest that analysis of the site of infection provides superior diagnostic accuracy compared to peripheral blood for pleural TB, likely due to the sequestration of effector cells at this acute stage of disease.


Conflict of interest statement

Competing Interests: The authors have declared that no competing interests exist.

Figures

Figure 1
Figure 1. Flow cytometry comparison between peripheral blood and pleural fluid.
(a) Ex vivo assessment of the cell phenotypes within the pleural fluid. Shown are representative flow cytometry profiles from a patient with pneumonia and one who was diagnosed with TB. Profiles are first gated on the lymphocyte population as determined by FSC and SSC. Following singlet and CD3 gating, analysis of CD4+ and CD8+ T cell populations is performed. (b) Analysis of a subject with pleural effusion caused by malignancy. In this case CD3 and CD19 are plotted together to illustrate T and B cell proportions in the blood (left) and pleural fluid (right) of a subject with a malignancy (subject 33). (c) Flow cytometry profile from blood and ascites where the blood had a distinct Vα24+CD4+ T cell population; absent from the ascites. (d) Functional analysis of PF cells. Overnight stimulation of PF cells with PPD was followed by intracellular cytokine detection. Following gating on the CD4+ T cells, TNF-α and IFN-γ positive cells were assessed. There was no response from the patient with a bacterial infection but a striking response from the patients with definite and probable TB. In particular, note the presence of a distinct IFN-γ+TNF-α+ double-positive cell population (IGTA; red box). (e) The CD4+ IGTA population was gated and the naïve/memory phenotype determined by CD27 and CD45RO expression (red-dot overlay). (f) Analysis of 12 subjects with evaluable data was performed using a Kruskal-Wallis test followed by Dunn's post-test comparison. We found the majority of the IGTA+ cells were of an effector memory phenotype (EM; CD27−CD45RO+), bottom right quadrant of (d). N = naïve (CD27+CD45RO−); CM = central memory (CD27+CD45RO+); EM = effector memory (CD27−CD45RO+) and TE = terminal effectors (CD27−CD45RO−).
Figure 2
Figure 2. Quantitative and qualitative analysis of PPD-specific T cell responses.
(a) Qualitative IFN-γ and TNF-α responses following overnight antigen stimulation of peripheral blood or pleural fluid cells. Shown are representative flow cytometry profiles from a patient with definite TB following overnight stimulation with anti-CD3/CD28 (positive control), ESAT-6/CFP-10 fusion protein (EC), PPD or unstimulated (media alone). (b) Quantitative assessment of IFN-γ, IL-2 and TNF-α secreting CD4+ T cells in subjects with TB and those without. Shown are the proportions of CD4+ T cells in the PF secreting IFN-γ, IL-2 or TNF-α in response to overnight stimulation with PPD. Statistical analysis was performed using a Mann-Whitney U test and p-values<0.05 were considered statistically significant (indicated). (c) Relative levels of polyfunctional T cell responses in subjects with TB or without. Shown are pie graphs demonstrating the proportion of cytokine-positive CD4+ T cells that produced only 1 of the cytokines (white), any 2 of the cytokines (black) or all 3 cytokines (red) from blood or pleural fluid of subjects with or without TB following anti-CD3/CD28, EC or PPD stimulation overnight. Statistical analysis of overall variance was performed using in-built SPICE software (ANOVA) and p-values indicate significantly decreased polyfunctionality compared to cells from the pleural fluid of subjects with TB. (d) Analysis of the functional profile of PPD-specific CD4+ T cells on the basis of simultaneous production of IFN-γ, IL-2 and TNF-α. All possible combinations of the 3 cytokines are shown along the y-axis. Statistical analysis was performed using a Mann-Whitney U- test and p-values are indicated (Pleural fluid TB significantly different to all 3 other groups).
Figure 3
Figure 3. Multiplex cytokine analysis of ex vivo pleural fluid samples.
Pleural fluid from subjects with TB (n = 27) and subjects without TB (n = 11) was assessed for 27 different cytokines using a Bioplex multi-cytokine analyser. Results are shown for IFN-γ, Eotaxin, IL-10, IL-13, IL6 and IP-10 levels in unstimulated fluid. Statistical analysis was performed using logistic regression analysis with Stata 3 software and multiple comparisons corrected for using Bonferonni's correction. Significance was set at p<0.05 and are indicated. Red dots indicate HIV-positive subjects.

References

    1. WHO 2010–2011 TB Factsheet. Available at: www.who.int/tb/publications/2010/factsheet_tb_2010_rev21feb11.pdf/ Accessed 11th April, 2011.
    1. Porcel JM. Pearls and myths in pleural fluid analysis. Respirology. 2011;16:44–52. - PubMed
    1. Krenke R, Korczynski P. Use of pleural fluid levels of adenosine deaminase and interferon gamma in the diagnosis of tuberculous pleuritis. Curr Opin Pulm Med. 2010;16:367–375. - PubMed
    1. Hodsdon WS, Luzze H, Hurst TJ, Quigley MA, Kyosiimire J, et al. HIV-1-related pleural tuberculosis: elevated production of IFN-gamma, but failure of immunity to Mycobacterium tuberculosis. AIDS. 2001;15:467–475. - PubMed
    1. Hirsch CS, Toossi Z, Johnson JL, Luzze H, Ntambi L, et al. Augmentation of apoptosis and interferon-gamma production at sites of active Mycobacterium tuberculosis-infection in human tuberculosis. J Infect Dis. 2001;183:79–788. - PubMed

Publication types