. 2012;7(1):e30706.
doi: 10.1371/journal.pone.0030706. Epub 2012 Jan 25.

The increased expression of integrin α6 (ITGA6) enhances drug resistance in EVI1(high) leukemia

Affiliations

The increased expression of integrin α6 (ITGA6) enhances drug resistance in EVI1(high) leukemia

Norio Yamakawa et al. PLoS One. 2012.

Abstract

Ecotropic viral integration site-1 (EVI1) is one of the candidate oncogenes for human acute myeloid leukemia (AML) with chromosomal alterations at 3q26. High EVI1 expression (EVI1(high)) is a risk factor for AML with poor outcome. Using DNA microarray analysis, we previously identified that integrin α6 (ITGA6) was upregulated over 10-fold in EVI1(high) leukemia cells. In this study, we determined whether the increased expression of ITGA6 is associated with drug-resistance and increased cell adhesion, resulting in poor prognosis. To this end, we first confirmed the expression pattern of a series of integrin genes using semi-quantitative PCR and fluorescence-activated cell sorter (FACS) analysis and determined the cell adhesion ability in EVI1(high) leukemia cells. We found that the adhesion ability of EVI1(high) leukemia cells to laminin increased with the increased expression of ITGA6 and integrin β4 (ITGB4). The introduction of small-hairpin RNA against EVI1 (shEVI1) into EVI1(high) leukemia cells reduced the cell adhesion ability and downregulated the expression of ITGA6 and ITGB4. In addition, the overexpression of EVI1 in EVI1(low) leukemia cells enhanced their cell adhesion ability and increased the expression of ITGA6 and ITGB4. In a subsequent experiment, the introduction of shRNA against ITGA6 or ITGB4 into EVI1(high) AML cells downregulated their cell adhesion ability; however, the EVI1(high) AML cells transfected with shRNA against ITGA6 could not be maintained in culture. Moreover, treating EVI1(high) leukemia cells with neutralizing antibodies against ITGA6 or ITGB4 resulted in an enhanced responsiveness to anti-cancer drugs and a reduction of their cell adhesion ability. The expression of ITGA6 is significantly elevated in cells from relapsed and EVI1(high) AML cases; therefore, ITGA6 might represent an important therapeutic target for both refractory and EVI1(high) AML.


Conflict of interest statement

Competing Interests: The authors have declared that no competing interests exist.

Figures

Figure 1
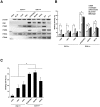
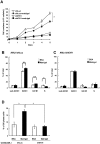
Figure 1. Higher cell adhesion ability in AML cell lines with EVI1high expression.
A. The expression of four integrin genes (ITGB1, ITGB4, ITGA4 and ITGA6), EVI1 and b-actin as a control was determined by semiquantitative RT-PCR in three different EVI1low and EVI1high AML cell lines and two primary AML cells lines with high EVI1 expression (PT9 and PT11). B. Six AML cell lines with low or high EVI1expression, as indicated in the figure, were incubated in culture medium on BSA, collagen, fibronectin, laminin or matrigel-coated plates; the percentage of the total number of incubated cells that adhered to the plates was designated as the binding activity (%). Each experiment was performed in triplicate, and the experiments were independently repeated at least three times. The data are given the as the mean ± standard error (S.E). The statistical analysis was performed using the Student's t-test (*p<0.05, vs. BSA-coated plate). C. Six AML cell lines were incubated with the murine osteoblastic cell line MC3T3-E1, and the percentage of cells that bound to MC3T3-E1 cells was determined. Each experiment was performed in triplicate, and the experiments were independently repeated at least three times. The statistical analysis was performed using the Student's t-test (*p<0.05, vs. EVI1low cell lines).
Figure 2
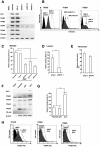
Figure 2. The expression of ITGA6 and ITGB4 is specifically dependent on the expression of EVI1.
A. The pattern of expression of EVI1 and five integrin genes (ITGB3, ITGB4, ITGA6, ITGA9 and VE-cadherin) in various UCSD/AML1 cell lines. Three cell lines with small hairpin RNA (shRNA) against EVI1 (shEVI1-1, -2 and -3) and the parental and UCSD/AML1 cell lines harboring an expression vector for shRNA against firefly luciferase were used to determine the levels of expression of five integrin (ITGB3, ITGB4, ITGA6, ITGA9 and VE-cadherin) and control (EVI1 and b-actin) genes using RT-PCR. B. The expression of ITGA6, ITGB4 and ITGB3 in AML1/shLuc and AML1/shEVI1-1 was determined using FACS analysis after staining the cells with PE-conjugated antibodies to specific integrins. C. The same cell lines described in (2a) were assessed for their ability to adhere to the matrigel. The relative binding activity was calculated by comparison to the basal binding activity of the parental UCSD/AML1 cell line. D and E. The binding activity of AML1/shLuc and AML1/EVI1-1 cells to laminin (D) and fibronectin (E) was compared. Both cell lines were cultured on laminin or fibronectin-coated plates. F and G. After the EVI1 expression vector was introduced into the U937 cell line, the expression of five integrin genes (ITGB3, ITGB4, ITGA6, ITGA9, VE-cadherin) and EVI1 was determined using RT-PCR. b-actin was used as a control (F). The cell adhesion ability of the U937/EVI1, U937/parental and U937/GFP cell lines was determined (G). H. The expression of ITGA6, ITGB4 and ITGB3 in U937/GFP and U937/EVI1 was determined using FACS analysis after staining the cells with PE-conjugated antibodies to specific integrins. Each experiment shown in Figure 2C, 2D, 2E, and 2G was performed in triplicate, and the experiments were independently repeated at least three times. The data are given as the mean ± S.E. The statistical analysis was performed using the Student's t-test (**p<0.05, vs. each control).
Figure 3
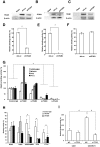
Figure 3. The adhesion ability of EVI1high leukemia is specifically dependent on the expression of ITGA6 and ITGB4.
A, B, and C. UCSD/AML1 cells were transiently transfected with expression vectors for shRNA against ITGA6 (shITGA6), ITGB4 (shITGB4), or ITGB1 (shITGB1), and the expression of ITGA6, ITGB4 and ITGB1 was determined using RT-PCR. UCSD/AML1 cells transfected with shRNA for firefly luciferase (shLuc) were used as a control, and the expression of b-actin was used as an internal control. D, E, and F. The cell adhesion ability of the cells in A, B, and C was determined through co-culture with the MC3T3-E1 cell line. The relative binding activity was calculated by comparison to the basal binding activity of control AML1/shLuc cells. G. The effect of neutralizing antibodies to the integrins on the cell binding activity of EVI1high leukemia cells. Two leukemia (UCSD/AML1 and MOLM1) and two primary human AML (PT9 and PT11) cell lines were cultured on matrigel-coated plates in the presence or absence of anti-ITGA6, ITGB2, ITGB3, or ITGB4 antibodies. The relative binding activity was calculated by comparison to the basal binding activity of each cell line treated with the control isotype IgG. H. Two EVI1low (K562 and U937) and three EVI1high (UCSD/AML1, PT9 and PT11) leukemia cell lines were treated with anti-ITGA6 or ITGB4 antibodies or with the control IgG, and the binding of each cell line to the matrigel-coated plates was determined. I. The parental and EVI1-expressing (U937/EVI1) U937 cell lines were treated with anti-ITGA6 or control IgG, and their binding to the MC3T3-E1 cell line was determined. The relative binding activity was calculated by comparison to the basal binding activity of the parental U937 cells treated with the control isotype IgG. Each experiment was performed in triplicate, and the experiments were independently repeated at least three times. The data are given as the mean ± S.E. The statistical analysis was performed using the Student's t-test (*p<0.05, vs. each control).
Figure 4
Figure 4. Laminin-332 on MC3T3-E1 cells is a main target for binding to EVI1high leukemia cells.
A. The expression of laminin a3 and g2 in MC3T3-E1 cells transfected with shRNA for firefly luciferase (shLuc) or laminin a3 (shLN332) was determined using RT-PCR. The expression of b-actin was used as an internal expression control. B. The binding of various myeloid leukemia cell lines to the two cell lines MC3T3-E1/shLuc or/shLN332 was determined. Each experiment was performed in triplicate, and the experiments were independently repeated at least three times. The data are given as the mean ± S.E. The statistical analysis was performed using the Student's t-test (**p<0.01; *p<0.05, vs. control).
Figure 5
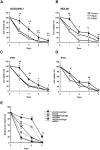
Figure 5. Drug sensitivity of EVI1high leukemia cells is restored by treatment with neutralizing antibodies to ITGA6 or ITGB4 or by transfection with small hairpin RNAs against EVI1 or ITGB4.
A–D. Two myeloid leukemia (UCSD/AML1 and MOLM1) and two primary AML (PT9 and PT11) cell lines were treated with 1×10⁻⁶ M Ara-C and anti-ITGA6 or ITGB4 antibodies for four days, and the viable cells were counted at each indicated time point. The percent cell viability in comparison with the number of untreated cells on each indicated day is shown. E. The UCSD/AML1 cells expressing shRNA for firefly luciferase (shLuc), ITGB4 (shITGB4) or EVI1 (shEVI1) were treated with Ara-C on BSA or matrigel-coated plates for three days. The viable cells were counted at each time point. The relative cell viability is expressed as a percentage of the viability of the untreated cells. Each experiment was performed in triplicate, and the experiments were independently repeated at least three times. The results are given as the mean ± S.E. The statistical analysis was performed using the Student's t-test (**p<0.05, vs. control).
Figure 6
Figure 6. Decreased cell growth with increased cell population in G0-phase of EVI1high AML cells cultured on the matrigel-coated plates.
A. The UCSD/AML1 cells were transfected with shEVI1 (AML1/shEVI1) or control shLuc vector (AML1/shLuc) to determine their cell growth under normal culture conditions on BSA or matrigel-coated plates. B and C. The cell cycle of AML1/shLuc as a control (B) and AML1/shEVI1 (C) were analyzed using BD FACSCalibur after double staining with BrdU-APC and 7-AAD. The percentage of viable cells in each cell cycle is indicated with white (BSA-coated) and black (matrigel-coated) bars. D. The percentage of AML1/shEVI1 (black bars) and AML1/shLuc (white bars) cells in the G0 phase cultured on matrigel or BSA-coated plates were analyzed using BD FACSCalibur after double staining with Ki67-Alexa647 and 7-AAD. Each experiment was performed in triplicate, and the experiments were independently repeated at least three times. The results are shown as the mean ± S.E. The statistical analysis was performed using the Student's t-test (**p<0.01; **p<0.05, vs. control).

Similar articles

Cited by

References

    1. Morishita K, Parker DS, Mucenski ML, Jenkins NA, Copeland NG, et al. Retroviral activation of a novel gene encoding a zinc finger protein in IL-3-dependent myeloid leukemia cell lines. Cell. 1988;54(6):831–840. - PubMed
    1. Mucenski L, Taylor BA, Ihle JN, Hartley JW, Morse HC, 3rd, et al. Identification of a common ecotropic viral integration site, Evi-1, in the DNA of AKXD murine myeloid tumors. Mol Cell Biol. 1988;8(1):301–308. - PMC - PubMed
    1. Morishita K, Parganas E, Bartholomew C, Sacchi N, Valentine MB, et al. The human Evi-1 gene is located on chromosome 3q24–q28 but is not rearranged in three cases of acute nonlymphocytic leukemias containing t(3;5)(q25;q34) translocations. Oncogene Res. 1990;5(3):221–231. - PubMed
    1. Barjesteh van Waalwijk van Doorn-Khosrovani S, Erpelinck C, van Putten WL, Valk PJ, van der Poel-van de Luytgaarde S, et al. High EVI1 expression predicts poor survival in acute myeloid leukemia: a study of 319 de novo AML patients. Blood. 2001;101(3):837–845. - PubMed
    1. Lugthart S, van Drunen E, van Norden Y, van Hoven A, Erpelinck CA, et al. High EVI1 levels predict adverse outcome in acute myeloid leukemia: prevalence of EVI1 over-expression and chromosome 3q26 abnormalities underestimated. Blood. 2008;111(8):4329–4337. - PubMed

Publication types

MeSH terms