. 2012 Feb 22;134(7):3508-16.
doi: 10.1021/ja2108883. Epub 2012 Feb 8.

Input-dependent induction of oligonucleotide structural motifs for performing molecular logic

Affiliations
Free PMC article

Input-dependent induction of oligonucleotide structural motifs for performing molecular logic

Tao Li et al. J Am Chem Soc. .
Free PMC article

Abstract

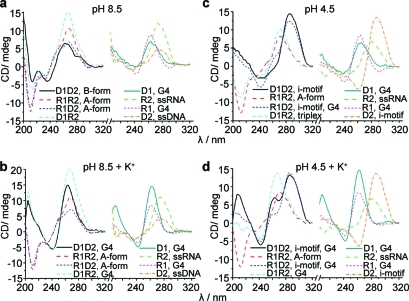
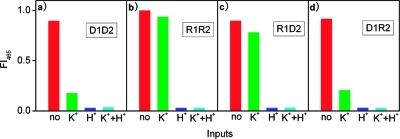
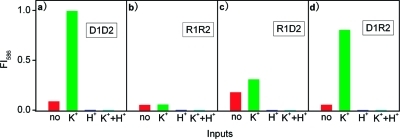
The K(+)-H(+)-triggered structural conversion of multiple nucleic acid helices involving duplexes, triplexes, G-quadruplexes, and i-motifs is studied by gel electrophoresis, circular dichroism, and thermal denaturation. We employ the structural interconversions for perfoming molecular logic operations, as verified by fluorimetry and colorimetry. Short G-rich and C-rich cDNA and RNA single strands are hybridized to produce four A-form and B-form duplexes. Addition of K(+) triggers the unwinding of the duplexes by inducing the folding of G-rich strands into DNA- or RNA G-quadruplex mono- and multimers, respectively. We found a decrease in pH to have different consequences on the resulting structural output, depending on whether the C-rich strand is DNA or RNA: while the protonated C-rich DNA strand folds into at least two isomers of a stable i-motif structure, the protonated C-rich RNA strand binds a DNA/RNA hybrid duplex to form a Y·RY parallel triplex. When using K(+) and H(+) as external stimuli, or inputs, and the induced G-quadruplexes as reporters, these structural interconversions of nucleic acid helices can be employed for performing logic-gate operations. The signaling mode for detecting these conversions relies on complex formation between DNA or RNA G-quadruplexes (G4) and the cofactor hemin. The G4/hemin complexes catalyze the H(2)O(2)-mediated oxidation of peroxidase substrates, resulting in a fluorescence or color change. Depending on the nature of the respective peroxidase substrate, distinct output signals can be generated, allowing one to operate multiple logic gates such as NOR, INH, or AND.


Figures

Figure 1
Figure 1
Oligonucleotide strand interconversions and construction of the logic gates. (a) Schematic for the interconversion of nucleic acid helical structures triggered by K+ and H+, two G-rich (blue), and two C-rich (red) oligonucleotides used here. In the G-quadruplex scheme, the blue rectangles represent G-residues, and the black lines the sugar–phosphate backbone. In the i-motif scheme, the dark gray and light gray spheres represent C and A residues, respectively, the red lines the sugar–phosphate backbone, and the orange lines the connection between each residue by H-bonds. The loop residues in the G-quadruplex and i-motif structure are not shown. (b) Multiple logic gate operations based on the structural conversion of nucleic acid helices, with K+ and H+ as two inputs.
Figure 2
Figure 2
Electrophoretograms of 0.2 nmol of oligonucleotides in 18% native gels under different conditions: (a) 50 mM, pH 8.5 Tris-Ac buffer; (b) 50 mM, pH 8.5 Tris-Ac buffer with 20 mM KCl; (c) 50 mM, pH 4.5 Tris-Ac buffer; red asterisk, a very small amount of G4 can be detected; and (d) 50 mM, pH 4.5 Tris-Ac buffer with 20 mM KCl. In lanes 4 and 9, the bands labeled “heteroduplex” or “duplex”, respectively, most likely correspond to residual D1R2 heteroduplex, but we do not have unambiguous proof that this is the case. *G4 monomer, **G4 dimer, ***G4 trimer. The framed bands labeled “i-motif” in (c) and (d) represent two i-motif isomers.
Figure 3
Figure 3
CD spectra of 20 μM oligonucleotides (each strand concentration) under different conditions: (a) 50 mM, pH 8.5 Tris-Ac buffer; (b) 50 mM, pH 8.5 Tris-Ac buffer with 20 mM KCl; (c) 50 mM, pH 4.5 Tris-Ac buffer; and (d) 50 mM, pH 4.5 Tris-Ac buffer with 20 mM KCl.
Figure 4
Figure 4
Melting profiles of 2.5 μM of four duplexes in 50 mM, pH 8.5 Tris-Ac buffer, and also D1R2 in pH 4.5 buffer. The absorbance was monitored at 260 nm and normalized.
Figure 5
Figure 5
Summary of strand interconversions under the different conditions employed and detection of G4 formation. (a) Overview of the structural conversion of nucleic acid helices triggered by K+ and H+. (b) The signal output of the logic system built on nucleic acid helices. DNA or RNA G-quadruplex combines with the catalytic cofactor hemin and exhibits peroxidase activity in the presence of substrates Sc, AR, and TMB, resulting in a change in the readout signal. For TMB oxidation, only the initial blue product is shown here.
Figure 6
Figure 6
Logic behaviors of four duplexes in the presence of Sc at the four input modes: no input, 20 mM K+, H+ (pH 8.5→4.5), K+ + H+. Experimental conditions: 1 μM duplex + 1 μM hemin, 10 μM Sc + 50 μM H2O2 (9 min reaction), λex = 390 nm. The fluorescence intensity at 465 nm (FI465) was normalized, serving as the output (1/0) with a threshold of 0.5. See Supporting Information Figure S8 for the corresponding fluorescence spectra.
Figure 7
Figure 7
Logic behaviors of four duplexes with AR as the substrate at the four input modes: no input, 20 mM K+ 3: H+ (pH 8.5→4.5), K+ + H+. Experimental conditions: 1 μM duplex + 1 μM hemin, 25 μM AR + 10 μM H2O2 (4 min reaction), λex = 560 nm. The fluorescence intensity at 586 nm (FI586) was normalized, serving as the output (1/0) with a threshold of 0.5. See Supporting Information Figure S9 for the corresponding fluorescence spectra.
Figure 8
Figure 8
Logic behaviors of four duplexes with TMB as the substrate at the four input modes: no input, 20 mM K+ 3: H+ (pH 8.5→4.5), K+ + H+. Experimental conditions: 1 μM duplex + 2 μM hemin, 200 μM TMB + 1 mM H2O2 (60 min reaction). The maximal absorbance at 652 nm (A652) was normalized, serving as the output (1/0) with a threshold of 0.5. In panel d, the H+ signal is low (0), as in Figure 2c only a very small amount of G4 was detected with D1R2 at pH 4.5. See Supporting Information Figure S10 for the corresponding fluorescence spectra.

Similar articles

Cited by

References

    1. Watson J. D.; Crick F. H. Nature 1953, 171, 737–738. - PubMed
    1. Fox K. R. Curr. Med. Chem. 2000, 7, 17–37. - PubMed
    1. Frank-Kamenetskii M. D.; Mirkin S. M. Annu. Rev. Biochem. 1995, 64, 65–95. - PubMed
    1. Gehring K.; Leroy J. L.; Gueron M. Nature 1993, 363, 561–565. - PubMed
    1. Snoussi K.; Nonin-Lecomte S.; Leroy J. L. J. Mol. Biol. 2001, 309, 139–153. - PubMed

Publication types