Review
. 2012 Apr;16(2):187-97.
doi: 10.1016/j.smrv.2011.12.003. Epub 2012 Jan 31.

Noradrenergic modulation of wakefulness/arousal

Affiliations
Review

Noradrenergic modulation of wakefulness/arousal

Craig W Berridge et al. Sleep Med Rev. 2012 Apr.

Abstract

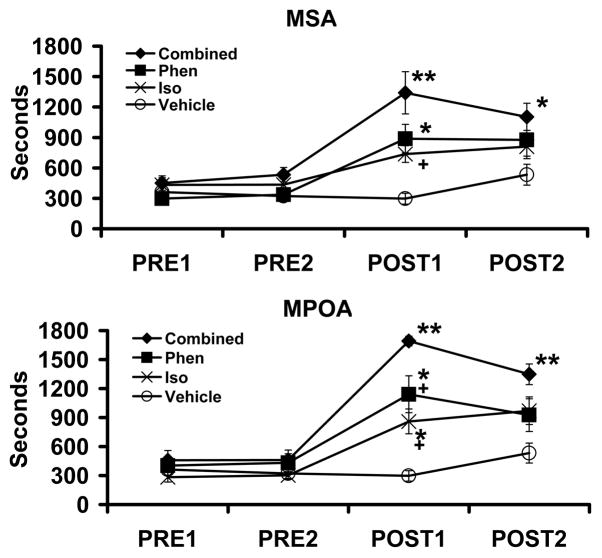
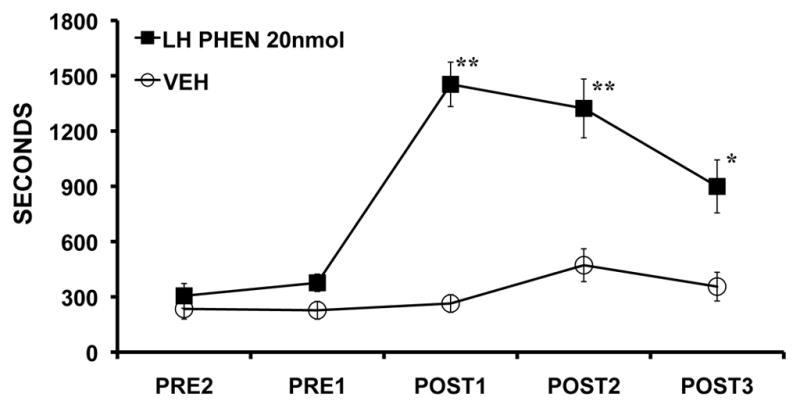
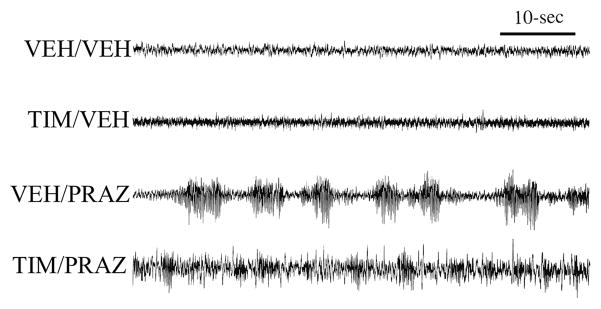
The locus coeruleus-noradrenergic system supplies norepinephrine throughout the central nervous system. State-dependent neuronal discharge activity of locus coeruleus noradrenergic neurons has long-suggested a role of this system in the induction of an alert waking state. Work over the past two decades provides unambiguous evidence that the locus coeruleus, and likely other noradrenergic nuclei, exert potent wake-promoting actions via an activation of noradrenergic β- and α₁-receptors located within multiple subcortical structures, including the general regions of the medial septal area, the medial preoptic area and, most recently, the lateral hypothalamus. Conversely, global blockade of β- and α₁-receptors or suppression of norepinephrine release results in profound sedation. The wake-promoting action of central noradrenergic neurotransmission has clinical implications for treatment of sleep/arousal disorders, such as insomnia and narcolepsy, and clinical conditions associated with excessive arousal, such as post-traumatic stress disorder.


Figures

Figure 1
Figure 1
Effects of LC activation on cortical EEG (ECoG) activity state. For these studies, the LC was first located electrophysiologically using a combined recording-infusion probe in the halothane-anesthetized rat. Once located, a 100–150 nl infusion of the cholinergic agonist, bethanechol, was made adjacent to the LC to activate LC neurons while simultaneously recording LC discharge activity. The effect of infusion-induced activation of the LC on ECoG (and hippocampal EEG, not shown) was monitored. A: Schematic of the infusion/recording probe used to activate LC. Bethanechol was infused 300–400 μm lateral or medial to the recording electrode that was used to locate the main body of the LC. B: Photomicrograph of a peri-LC infusion site. In this example, an infusion lateral of the LC is depicted. N indicates position within the track created by the infusion needle where the infusate exited the needle. E indicates position of the recording electrode within the LC. C: Simultaneous effects of bethanechol infusion on LC activity (LC Trigger, bottom trace) and ECoG activity (top trace). Bethanechol infusion (indicated by horizontal bar) increased LC discharge rate approximately two-thirds of the way through the 60-second infusion. Several seconds following LC activation, EEG desynchronization is observed. EEG recordings were ipsilateral to the manipulated LC. However, identical effects were observed in the contralateral hemisphere. D: Power spectral analyses of 11-second pre-infusion and post-infusion ECoG epochs. Power of low-frequency activity is decreased following bethanechol-induced activation of ECoG. E: Schematic depicting bethanechol infusion sites that were effective or ineffective for activating forebrain EEG. Solid circles indicate sites at which bethanechol infusion activated EEG. Shaded boxes indicate sites at which bethanechol infusion had no obvious EEG effects. There is a radius of approximately 500 μm around LC within which infusions, placed either medially or laterally, activated forebrain EEG. Infusions placed immediately anterior to the LC were also ineffective (not shown). These mapping studies strongly argue against drug action at other arousal-related brainstem nuclei (e.g. cholinergic, serotonergic). Abbreviations: Me5, mesencephalic nucleus of the trigeminal nerve; Mo5, motor nucleus of the trigeminal nerve; Pr5, principle sensory nucleus of the trigeminal nerve; 4V, fourth ventricle (from).
Figure 2
Figure 2
Effects of bilateral suppression of LC discharge in the lightly-anesthetized rat. A similar experimental approach was taken to that outlined in Figure 1, other than 1) animals were lightly anesthetized and 2) they received bilateral peri-LC clonidine infusions (35, 100 ng/35, 100 nl). The top panels (LC) depict oscilloscope traces of a multiunit LC recording before (Pre-Clonidine) and after (Post-Clonidine) a peri-LC clonidine infusion. Clonidine completely suppressed LC discharge. The effects of LC suppression on cortical EEG (ECoG, middle panels) and hippocampal EEG (HEEG, bottom panels) were characterized. Shown are 25-second raw ECoG/HEEG traces along with the results of power spectral analysis (graphs below raw traces). Power spectral analysis was calculated on 8-minute epochs that included the 25-second EEG segment shown. Prior to clonidine infusion, baseline EEG was stably activated as indicated by limited slow-wave activity in cortical EEG (ECoG, middle panels) and nearly pure theta activity in hippocampal EEG (HEEG, bottom panels). Peri-LC clonidine infusions that completely suppressed LC discharge bilaterally resulted in a profound increase in slow-wave activity in ECoG and HEEG recordings and a decrease in theta activity in HEEG. These effects appeared within seconds-minutes of LC suppression and persisted for the entire period in which LC neurons were completely inactive (> 60–90 minutes). Recovery from these EEG effects quickly followed the emergence of minimal LC discharge activity. Shading in the power spectral plots indicates the theta frequency band (2.3–6.9 Hz) in the HEEG power spectra. Mapping studies indicated an ~500–600μm radius around the LC for clonidine-induced increases in EEG indices of sedation (from).
Figure 3
Figure 3
NE acts within the general regions of the MSA and MPOA to promote waking. A) Schematics indicate boundaries within the general regions of the MSA (Top Row) and MPOA (Bottom Row) within which NE and NE α1- and β-receptor agonist infusions promote waking in the sleeping rat. These studies identify a nearly continuous portion of the medial basal forebrain where NE acts to promote waking (dotted lines) that extends in the anterior-posterior dimension from the anterior MSA to the posterior MPOA. The region termed the MSA encompasses the medial septum, the vertical limb of the diagonal band of Broca, the posterior portions of the shell region of the nucleus accumbens. The region termed the MPOA encompasses preoptic area of the hypothalamus and portions of the bed nucleus of the stria terminalis (BST). Previous mapping studies suggest that the shell accumbens or BST are not prominently involved in NE-induced waking. Infusions outside the MSA and MPOA are generally ineffective at increasing waking. Panels are arranged anterior-posterior with the anterior-most panel shown in the upper left and the posterior-most panel shown in the bottom right position. Photomicrographs depict intra-tissue infusion sites from experiments involving NE agonist infusions into the MSA and MPOA. In these photomicrographs, large arrows indicate the most ventral extent of the infusion needle. Small arrow indicates the lateral ventricle. Note minimal tissue damage associated with these infusions. B: Effects of NE infusions into the MPOA on EEG and EMG indices of sleep-wake state. Shown are 10-minute traces of cortical EEG (ECoG) and EMG recorded immediately prior to (top traces, PRE NE) and 10-minute following (bottom traces, POST NE) NE infusion into MPOA. Prior to the infusion, the animal spent the majority of time in slow-wave sleep (resting with large amplitude, slow-wave activity present in ECoG and low-amplitude activity present in EMG). The most striking post-infusion changes are the decrease in large-amplitude, slow-wave ECoG activity and the increase in EMG amplitude, indicative of alert, active waking. Depending on dose, this wake-promoting effect is observed for > 90 minutes. Similar effects are observed with NE agonist infusions into the MSA. Abbreviations: AC, anterior commissure; CC, corpus callosum; CP, caudate-putamen; GP, globus pallidus; I, internal capsule; LS, lateral septum; LV, lateral ventricle; M, midline, MS, medial septum; NA, nucleus accumbens; SI, substantia innominata (from).
Figure 4
Figure 4
NE and α1- and β-agonist infusions within the MSA and MPOA, but not SI, promote waking. Shown are the effects of NE, the α1-agonist, phenylephrine (PHEN), and the β-agonist, isoproterenol (ISO) infused into MPOA (top and middle panels) or MSA (bottom panel). Symbols represent mean (± SEM) of time (seconds) spent awake in 30-minute (1800-seconds) epochs. PRE1 and PRE2 represent 30-min pre-infusion epochs occurring immediately prior to the infusion. POST1-POST3 represent 30-minute post-infusions epochs, beginning immediately following the infusions. Top Panel: Effects of unilateral infusion of vehicle, 4 nmol NE, or 16 nmol NE, infused into either the MPOA or SI on time spent awake. Middle Panel: Effects of unilateral infusion of vehicle, PHEN (40 nmol) or ISO (15 nmol) infused into either the MPOA or SI on time spent awake. NE, PHEN and ISO increase time spent awake when infused into the MPOA, but not into the SI. The only exception to this was observed with the high dose of NE. In this case the latency to waking was longer, the magnitude of waking smaller and the duration shorter than that observed with infusions into the MPOA. The wake-promoting effects of intra-MPOA infusion of all of these compounds are dose-dependent. Larger effects are observed with bilateral infusions. Similar wake-promoting effects of β and α1-receptor activation are observed in MSA. Bottom Panel: Effects of vehicle and PHEN (10 nmol, 50 nmol) infusion into the MSA on time spent awake. PHEN exerts dose dependent wake-promoting effects when infused into the MSA. Similar effects were observed with infusion of the β-agonist, ISO. For all panels, a lack of visible error bars indicates the magnitude of the SEM fell within the range corresponding to the dimensions of the symbol. There were no significant differences between any of the groups during the pre-infusion epochs. *P<0.05, **P<0.01 compared to PRE-1 (from–, }).
Figure 5
Figure 5
Additive wake-promoting effects of α1- and β-agonist receptor stimulation within the MSA and MPOA. Panels depict the wake-promoting effects of vehicle, 10 nmol of the α1-agonist, phenylephrine (PHEN), 4 nmol of the β-agonist, isoproterenol (ISO), and combined PHEN + ISO (Combined) when infused into the MSA (Top Panel) and MPOA (Bottom Panel). For both regions, a relatively low dose of each drug was used that elicited only a mild wake-promoting action when administered alone. In the combined treatment group, additive wake-promoting effects of ISO and PHEN were observed. Symbols represent means (± SEM) of time (seconds) spent awake per 30-min testing epoch. PRE1 and PRE2 represent 30-minute pre-infusion epochs occurring immediately prior to the infusion. POST1-POST3 represent 30-minute post-infusions epochs, beginning immediately following the infusions. *P<0.05, **P<0.01 compared to PRE1; +P<0.05 compared to Combined (from).
Figure 6
Figure 6
NE acts within the LH to promote alert waking. Shown are the effects of bilateral intra-LH infusion of the α1-agonist, phenylephrine (PHEN; 20 nmol/250 nl) on time spent awake as determined from EEG/EMG indices. At this dose, PHEN increased time spent awake for a sustained period. Unilateral infusions also produced significant increases in waking, but of a somewhat lesser intensity. Intra-LH β-agonist infusion produced smaller magnitude, though significant, wake-promoting effects (data not shown). PRE1 and PRE2 represent 30-minute pre-infusion epochs occurring immediately prior to the infusion. POST1-POST3 represent 30-minute post-infusions epochs, beginning immediately following the infusions. Symbols represent means (± SEM) of time (seconds) spent awake per 30-min testing epoch. *P<0.05, **P<0.01 compared to PRE1 (from).
Figure 7
Figure 7
Synergistic sedative effects of α1- and β-receptor blockade globally within the brain. Shown are the effects of the β-antagonist, timolol (ICV), the α1-antagonist, prazosin (IP) and combined antagonist treatment on cortical EEG in animals exposed to an arousing brightly-lit novel environment. Animals were treated 30-minutes prior to testing with: 1) ICV vehicle + IP saline (VEH/VEH); 2) 150 μg ICV timolol + IP saline (TIM/VEH); 3) ICV vehicle + IP 500 μg/kg prazosin (VEH/PRAZ,), and; 4) combined timolol + prazosin (TIM/PRAZ). In this figure, EEG traces are from the second 5-min epoch of exposure to the novel environment. Vehicle-treated controls displayed behavioral and EEG indices of alert waking throughout most of the recording session. This was reflected in sustained EEG desynchronization (low-amplitude, high-frequency). β-receptor blockade alone (TIM/VEH) had no effects on EEG activity. α1-receptor blockade alone (VEH/PRAZ) increased the frequency and duration of sleep spindles (high-voltage spindles). In contrast to that observed with β-receptor blockade alone, in the presence of α1-receptor blockade, β-receptor blockade produced substantial increases in large-amplitude, slow-wave activity. Power spectral analysis quantified and confirmed these qualitative observations (data not shown; from).

References

    1. Bushnell MC, Goldberg ME, Robinson DL. Behavioral enhancement of visual responses in monkey cerebral cortex. I. Modulation in posterior parietal cortex related to selective visual attention. J Neurophysiol. 1981;46(4):755–72. - PubMed
    1. Evarts EV. Effects of sleep and waking on spontaneous and evoked discharge of single units in visual cortex. Fed Proc. 1960;19:828–37. - PubMed
    1. Von Economo C. Sleep as a problem of localization. J Nerv Ment Dis. 1930;71:249–59.
    1. Bremer F. Cerebral activity during sleep and narcosis: Contribution to the study of the mechanisms of sleep. Bull l’Acad Royale Med Belgique. 1937;4:240–75.
    1. Moruzzi G, Magoun HW. Brain stem reticular formation and activation of the EEG. Electroencephalogr Clin Neurophysiol. 1949;1:455–73. - PubMed

Publication types

MeSH terms

Substances