. 2012 Sep;6(9):1677-87.
doi: 10.1038/ismej.2011.197. Epub 2012 Feb 2.

Structure, fluctuation and magnitude of a natural grassland soil metagenome

Affiliations

Structure, fluctuation and magnitude of a natural grassland soil metagenome

Tom O Delmont et al. ISME J. 2012 Sep.

Abstract

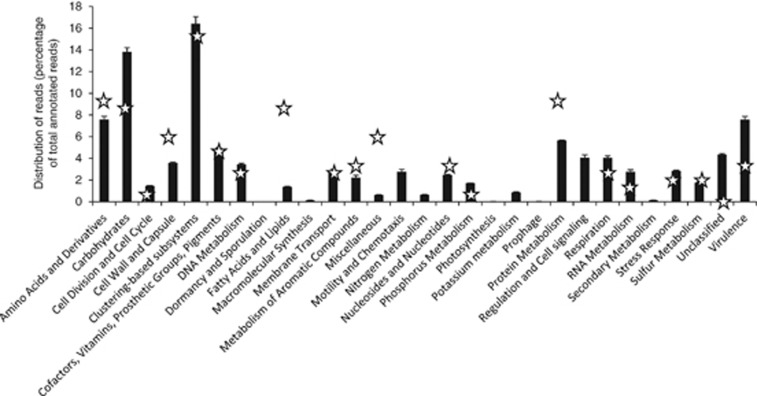
The soil ecosystem is critical for human health, affecting aspects of the environment from key agricultural and edaphic parameters to critical influence on climate change. Soil has more unknown biodiversity than any other ecosystem. We have applied diverse DNA extraction methods coupled with high throughput pyrosequencing to explore 4.88 × 10(9) bp of metagenomic sequence data from the longest continually studied soil environment (Park Grass experiment at Rothamsted Research in the UK). Results emphasize important DNA extraction biases and unexpectedly low seasonal and vertical soil metagenomic functional class variations. Clustering-based subsystems and carbohydrate metabolism had the largest quantity of annotated reads assigned although <50% of reads were assigned at an E value cutoff of 10(-5). In addition, with the more detailed subsystems, cAMP signaling in bacteria (3.24±0.27% of the annotated reads) and the Ton and Tol transport systems (1.69±0.11%) were relatively highly represented. The most highly represented genome from the database was that for a Bradyrhizobium species. The metagenomic variance created by integrating natural and methodological fluctuations represents a global picture of the Rothamsted soil metagenome that can be used for specific questions and future inter-environmental metagenomic comparisons. However, only 1% of annotated sequences correspond to already sequenced genomes at 96% similarity and E values of <10(-5), thus, considerable genomic reconstructions efforts still have to be performed.


Figures

Figure 1
Figure 1
The sampling and DNA extraction schematic for the 13 pyrosequencing runs. The two pairs, F2a/F2b and J1a10/J1b10, are respectively replicate runs from the same DNA extraction and distinct DNA samples extracted sequentially from the same soil sample.
Figure 2
Figure 2
Cluster tree confronting the 13 pyrosequencing runs, two other soil metagenomes and a metagenome corresponding to Sargasso Sea environment based on the number of reads assigned to each of the 835 metabolic subsystems detected by MG-RAST at least in one data set. The tree was constructed using Euclidean distances, nPCA ordination method, and complete cluster method.
Figure 3
Figure 3
Relative distribution (in percentage of annotated reads) of the 29 major metabolic subsystems (using SEED subsystems in the MG-RAST program) detected in the Rothamsted soil metagenome. SD correspond to the variability among sequencing runs. The stars represent the relative distribution among the 100 largest contigs after assembly.
Figure 4
Figure 4
Relative distribution of microbial classes in the Rothamsted soil metagenome. SD correspond to the fluctuation of the relative distribution between different pyrosequencing runs. The total number of reads annotated by the different methods is not the same as the SEED annotation using all annotated reads and the others use only identified 16S rRNA genes (rrs). The version of Greengenes database used within MG-RAST was from 2008. The stars represent the relative distribution among the 100 largest contigs after assembly based on SEED annotation.
Figure 5
Figure 5
(a) Relation between number of 454 sequence reads used in the Newbler assembler and the percentage of reads not combined with any other reads (singletons). A best fit equation for this relationship is: pSingleton=a*[nbReads]b+c with the following four parameters: Estimated value, s.e., t value, Pr(>∣t∣)—for (a) −6.714 × 10⁻⁴, 5.409 × 10⁻⁵, −12.41, 5.06 × 10⁻⁶; for (b): 3.703 × 10⁻¹, 4.446 × 10⁻³, 83.30, 9.46 × 10⁻¹²; for (c) 1.047, 2.372 × 10⁻³, 441.56, <2 × 10⁻¹⁶. (b) Plot of the number of reads per contig as a function of the length of the contigs produced with all the reads from the 13 pyrosequencing runs using the 13 pools of DNA extracted from the Park Grass soil at Rothamsted Research.
Figure 6
Figure 6
The principal component analysis of three ecosystems using the relative distribution of reads in the different metabolic subsystems for the metagenomic sequences available in the public database in addition to those produced here. The large metabolic classes as determined by MG-RAST are mapped on the same PCA as the ecosystems.

References

    1. Agarwal N, Bishai WR. cAMP signaling in Mycobacterium tuberculosis. Indian J Exp Biol. 2009;47:393–400. - PubMed
    1. Akhter Y, Yellaboina S, Farhana A, Ranjan A, Ahmed N, Hasnain SE. Genome scale portrait of cAMP-receptor protein (CRP) regulons in mycobacteria points to their role in pathogenesis. Gene. 2008;407:148–158. - PubMed
    1. Allwood AC, Walter MR, Kamber BS, Marshall CP, Burch IW. Stromatolite reef from the Early Archaean era of Australia. Nature. 2006;441:714–718. - PubMed
    1. Bertrand H, Poly F, Van VT, Lombard N, Nalin R, Vogel TM, et al. High molecular weight DNA recovery from soils prerequisite for biotechnological metagenomic library construction. J Microbiol Methods. 2005;62:1–11. - PubMed
    1. Boyd PW, Jickells T, Law CS, Blain S, Boyle EA, Buesseler KO, et al. Mesoscale iron enrichment experiments 1993–2005: synthesis and future directions. Science. 2007;315:612–617. - PubMed

Publication types