Multicenter Study
. 2012 Jun;81(11):1108-15.
doi: 10.1038/ki.2011.481. Epub 2012 Feb 1.

Dialysis outcomes and analysis of practice patterns suggests the dialysis schedule affects day-of-week mortality

Affiliations
Multicenter Study

Dialysis outcomes and analysis of practice patterns suggests the dialysis schedule affects day-of-week mortality

Hui Zhang et al. Kidney Int. 2012 Jun.

Abstract

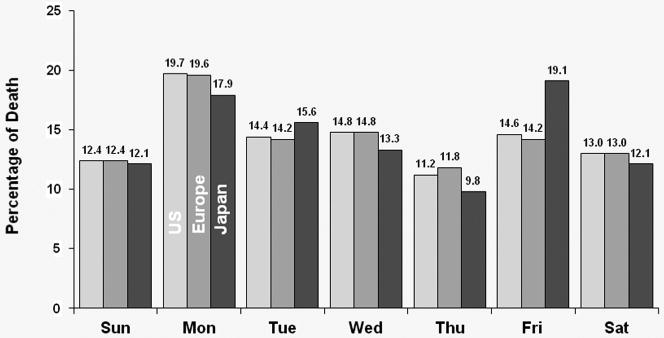
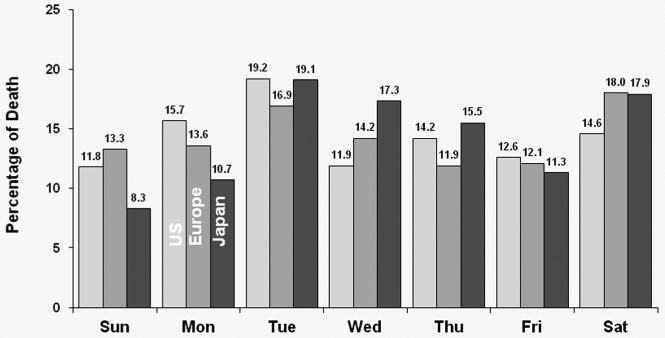
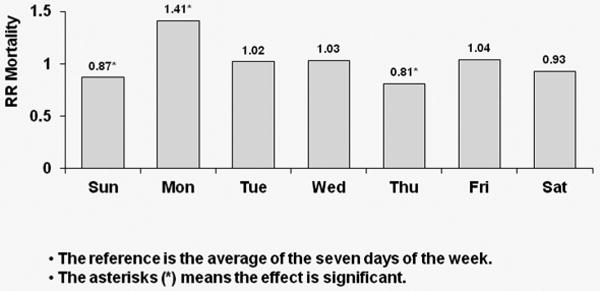
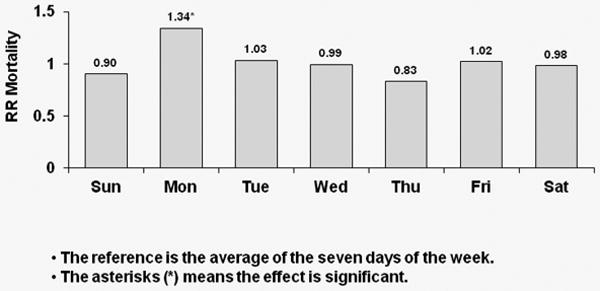
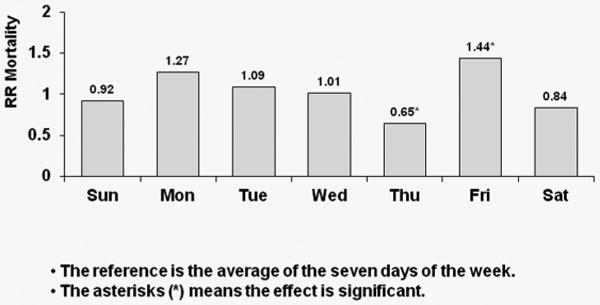
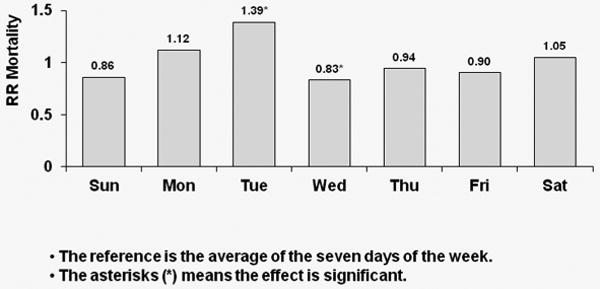
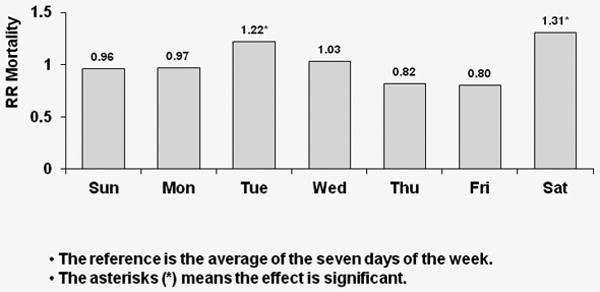
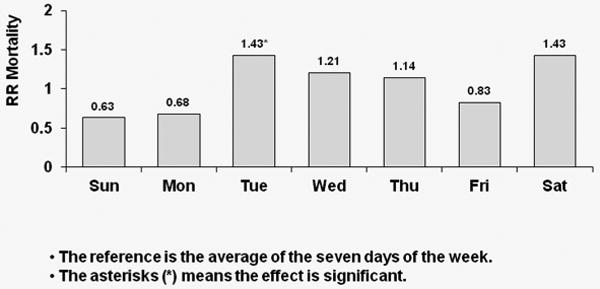
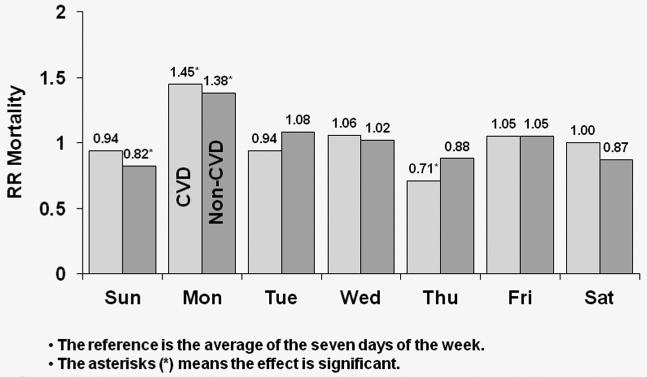
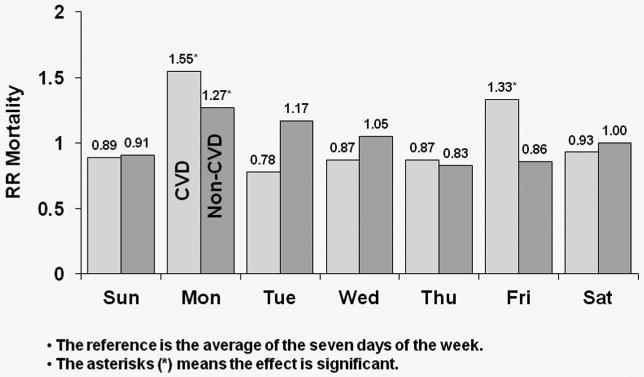
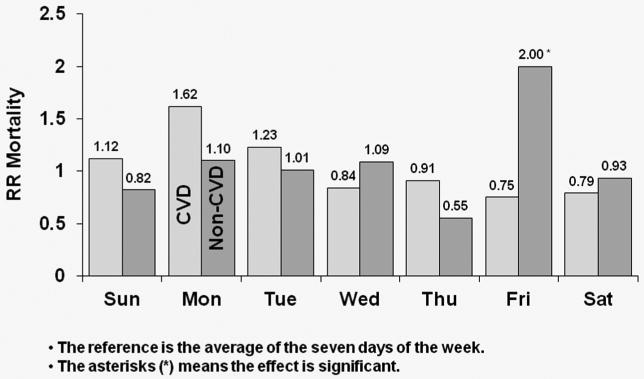
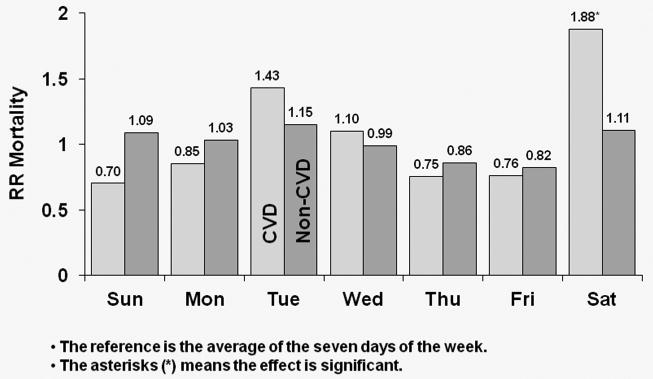
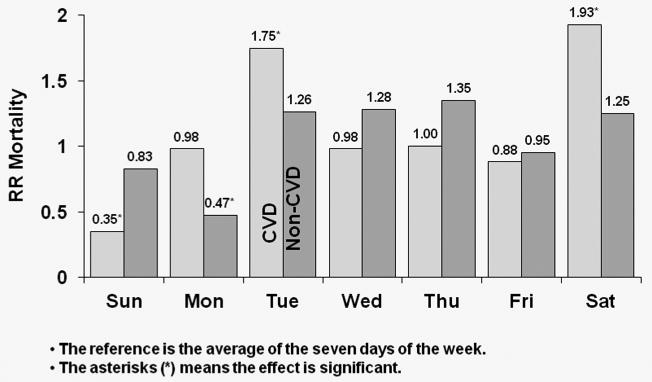
The risk of death for hemodialysis patients is thought to be highest on the days following the longest interval without dialysis (usually Mondays and Tuesdays); however, existing results are inconclusive. To clarify this we analyzed Dialysis Outcomes and Practice Patterns Study (DOPPS) data of 22,163 hemodialysis patients from the United States, Europe, and Japan. Our study focused on the association between dialysis schedule and day of the week of all-cause, cardiovascular, and noncardiovascular mortality with day-of-week coded as a time-dependent covariate. The models were adjusted for dialysis schedule, age, country, DOPPS phase I or II, and other demographic and clinical covariates, and compared mortality on each day to the 7-day average. Patients on a Monday-Wednesday-Friday (MWF) schedule had elevated all-cause mortality on Mondays, and those on a Tuesday-Thursday-Saturday (TTS) schedule had increased risk of mortality on Tuesdays in all three regions. The association between day-of-week mortality and schedule was generally stronger for cardiovascular than noncardiovascular mortality, and was most pronounced in the United States. Unexpectedly, Japanese patients on a MWF schedule had a higher risk of noncardiovascular mortality on Fridays, and European patients on a TTS schedule experienced an elevated cardiovascular mortality on Saturdays. Thus, future studies are needed to evaluate the influence of practice patterns on schedule-specific mortality and factors that could modulate this effect.


Figures

Figure 1
Figure 1
Figure 1a: Distribution of deaths by day of the week for patients receiving dialysis on MWF (all patients). For MWF schedule patients, Monday had a much higher percentage of deaths for the U.S., European and Japanese patients. Figure 1b: Distribution of deaths by day of the week for patients receiving dialysis on TTS (all patients). For TTS schedule patients, Tuesday had the highest percentage of deaths for the U.S., European and Japanese patients
Figure 1
Figure 1
Figure 1a: Distribution of deaths by day of the week for patients receiving dialysis on MWF (all patients). For MWF schedule patients, Monday had a much higher percentage of deaths for the U.S., European and Japanese patients. Figure 1b: Distribution of deaths by day of the week for patients receiving dialysis on TTS (all patients). For TTS schedule patients, Tuesday had the highest percentage of deaths for the U.S., European and Japanese patients
Figure 2
Figure 2
Figure 2a: Relative Risk of Mortality (all-cause) by Day: U.S. patients receiving dialysis on MWF Covariate-adjusted hazard ratios (HRs) of all-cause mortality by day-of-week with MWF schedule for U.S. patients Figure 2b: Relative Risk of Mortality (all-cause) by Day: European patients receiving dialysis on MWF Covariate-adjusted hazard ratios (HRs) of all-cause mortality by day-of-week with MWF schedule for European patients Figure 2c: Relative Risk of Mortality (all-cause) by Day: Japanese patients receiving dialysis on MWF Covariate-adjusted hazard ratios (HRs) of all-cause mortality by day-of-week with MWF schedule for Japanese patients
Figure 2
Figure 2
Figure 2a: Relative Risk of Mortality (all-cause) by Day: U.S. patients receiving dialysis on MWF Covariate-adjusted hazard ratios (HRs) of all-cause mortality by day-of-week with MWF schedule for U.S. patients Figure 2b: Relative Risk of Mortality (all-cause) by Day: European patients receiving dialysis on MWF Covariate-adjusted hazard ratios (HRs) of all-cause mortality by day-of-week with MWF schedule for European patients Figure 2c: Relative Risk of Mortality (all-cause) by Day: Japanese patients receiving dialysis on MWF Covariate-adjusted hazard ratios (HRs) of all-cause mortality by day-of-week with MWF schedule for Japanese patients
Figure 3
Figure 3
Figure 3a: Relative Risk of Mortality (all-cause) by Day: U.S. patients receiving dialysis on TTS Covariate-adjusted hazard ratios (HRs) of all-cause mortality by day-of-week with TTS schedule for U.S. patients Figure 3b: Relative Risk of Mortality (all-cause) by Day: European patients receiving dialysis on TTS Covariate-adjusted hazard ratios (HRs) of all-cause mortality by day-of-week with TTS schedule for European patients Figure 3c: Relative Risk of Mortality (all-cause) by Day: Japanese patients receiving dialysis on TTS Covariate-adjusted hazard ratios (HRs) of all-cause mortality by day-of-week with TTS schedule for Japanese patients
Figure 3
Figure 3
Figure 3a: Relative Risk of Mortality (all-cause) by Day: U.S. patients receiving dialysis on TTS Covariate-adjusted hazard ratios (HRs) of all-cause mortality by day-of-week with TTS schedule for U.S. patients Figure 3b: Relative Risk of Mortality (all-cause) by Day: European patients receiving dialysis on TTS Covariate-adjusted hazard ratios (HRs) of all-cause mortality by day-of-week with TTS schedule for European patients Figure 3c: Relative Risk of Mortality (all-cause) by Day: Japanese patients receiving dialysis on TTS Covariate-adjusted hazard ratios (HRs) of all-cause mortality by day-of-week with TTS schedule for Japanese patients
Figure 4
Figure 4
Figure 4a: Relative Risk of Mortality (CVD and non-CVD) by Day: U.S. patients receiving dialysis on MWF Covariate-adjusted HRs of cardiovascular disease (CVD) and non-CVD mortality by day-of-week for MWF schedule for U.S. patients Figure 4b: Relative Risk of Mortality (CVD and non-CVD) by Day: European patients receiving dialysis on MWF Covariate-adjusted HRs of cardiovascular disease (CVD) and non-CVD mortality by day-of-week for MWF schedule for European patients Figure 4c: Relative Risk of Mortality (CVD and non-CVD) by Day: Japanese patients receiving dialysis on MWF Covariate-adjusted HRs of cardiovascular disease (CVD) and non-CVD mortality by day-of-week for MWF schedule for Japanese patients
Figure 4
Figure 4
Figure 4a: Relative Risk of Mortality (CVD and non-CVD) by Day: U.S. patients receiving dialysis on MWF Covariate-adjusted HRs of cardiovascular disease (CVD) and non-CVD mortality by day-of-week for MWF schedule for U.S. patients Figure 4b: Relative Risk of Mortality (CVD and non-CVD) by Day: European patients receiving dialysis on MWF Covariate-adjusted HRs of cardiovascular disease (CVD) and non-CVD mortality by day-of-week for MWF schedule for European patients Figure 4c: Relative Risk of Mortality (CVD and non-CVD) by Day: Japanese patients receiving dialysis on MWF Covariate-adjusted HRs of cardiovascular disease (CVD) and non-CVD mortality by day-of-week for MWF schedule for Japanese patients
Figure 5
Figure 5
Figure 5a: Relative Risk of Mortality (CVD and non-CVD) by Day: U.S. patients receiving dialysis on TTS HRs of CVD and non-CVD mortality by day-of-week for TTS schedule patients in U.S. patients Figure 5b: Relative Risk of Mortality (CVD and non-CVD) by Day: European patients receiving dialysis on TTS HRs of CVD and non-CVD mortality by day-of-week for TTS schedule patients in European patients Figure 5c: Relative Risk of Mortality (CVD and non-CVD) by Day: Japanese patients receiving dialysis on TTS HRs of CVD and non-CVD mortality by day-of-week for TTS schedule patients in Japanese patients
Figure 5
Figure 5
Figure 5a: Relative Risk of Mortality (CVD and non-CVD) by Day: U.S. patients receiving dialysis on TTS HRs of CVD and non-CVD mortality by day-of-week for TTS schedule patients in U.S. patients Figure 5b: Relative Risk of Mortality (CVD and non-CVD) by Day: European patients receiving dialysis on TTS HRs of CVD and non-CVD mortality by day-of-week for TTS schedule patients in European patients Figure 5c: Relative Risk of Mortality (CVD and non-CVD) by Day: Japanese patients receiving dialysis on TTS HRs of CVD and non-CVD mortality by day-of-week for TTS schedule patients in Japanese patients

Comment in

References

    1. Bleyer AJ, Russell GB, Satko SG. Sudden and cardiac death rates in hemodialysis patients. Kidney Int. 1999;55:1553–1559. - PubMed
    1. Karnik JA, Young BS, Lew NL, et al. Cardiac arrest and sudden death in dialysis units. Kidney Int. 2001;60:350–357. - PubMed
    1. Bleyer AJ, Hartman J, Brannon PC, et al. Characteristics of sudden death in hemodialysis patients. Kidney Int. 2006;69:2268–2273. - PubMed
    1. Zager PG, Nikolic J, Brown RH, et al. “U” curve association of blood pressure and mortality in hemodialysis patients. Kidney Int. 1998;54:561–569. - PubMed
    1. Shoji T, Tsubakihara Y, Fujii M, et al. Hemodialysis-associated hypotension as an independent risk factor for two-year mortality in hemodialysis patients. Kidney Int. 2004;66:1212–1220. - PubMed

Publication types

MeSH terms