

The dramatic increase in total knee replacement utilization rates in the United States cannot be fully explained by growth in population size and the obesity epidemic
- PMID: 22298051
- PMCID: PMC3262184
- DOI: 10.2106/JBJS.J.01958
The dramatic increase in total knee replacement utilization rates in the United States cannot be fully explained by growth in population size and the obesity epidemic
Abstract
Background: Total knee replacement utilization in the United States more than doubled from 1999 to 2008. Although the reasons for this increase have not been examined rigorously, some have attributed the increase to population growth and the obesity epidemic. Our goal was to investigate whether the rapid increase in total knee replacement use over the past decade can be sufficiently attributed to changes in these two factors.
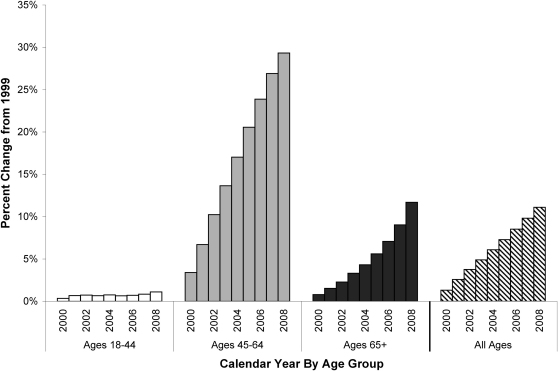
Methods: We used data from the Nationwide Inpatient Sample to estimate changes in total knee replacement utilization rates from 1999 to 2008, stratified by age (eighteen to forty-four years, forty-five to sixty-four years, and sixty-five years or older). We obtained data on obesity prevalence and U.S. population growth from federal sources. We compared the rate of change in total knee replacement utilization with the rates of population growth and change in obesity prevalence from 1999 to 2008.
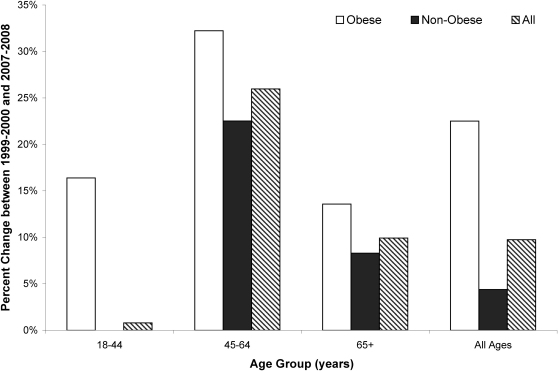
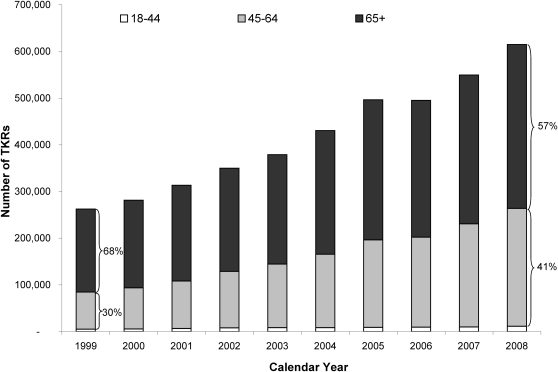
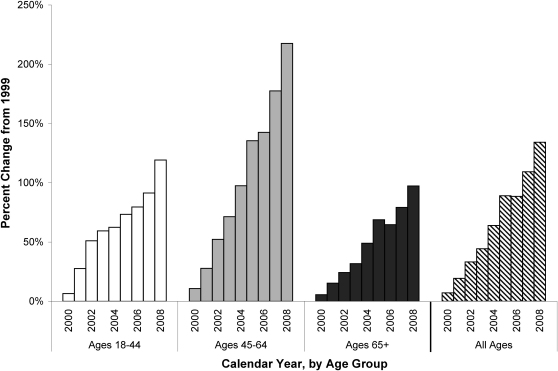
Results: In 2008, 615,050 total knee replacements were performed in the United States adult population, 134% more than in 1999. During the same time period, the overall population size increased by 11%. While the population of forty-five to sixty-four-year-olds grew by 29%, the number of total knee replacements in this age group more than tripled. The number of obese and non-obese individuals in the United States increased by 23% and 4%, respectively. Assuming unchanged indications for total knee replacement among obese and non-obese individuals with knee osteoarthritis over the last decade, these changes fail to account for the 134% growth in total knee replacement use.
Conclusions: Population growth and obesity cannot fully explain the rapid expansion of total knee replacements in the last decade, suggesting that other factors must also be involved. The disproportionate increase in total knee replacements among younger patients may be a result of a growing number of knee injuries and expanding indications for the procedure.
Figures
References
-
- Healthcare Cost and Utilization Project (HCUP). Nationwide Inpatient Sample (NIS) Agency for Healthcare Research and Quality; 1999-2008. http://www.ahrq.gov/data/hcup/. Accessed 2011 May 6 - PubMed
-
- Healthcare Cost and Utilization Project (HCUP), Agency for Healthcare Research and Quality; Stranges E, Russo A, Friedman B. Statistical brief #82: procedures with the most rapidly increasing hospital costs, 2004–2007. 2009. www.hcup-us.ahrq.gov/reports/statbriefs/sb82.jsp. Accessed 2011 May 6 - PubMed
-
- Kurtz S, Ong K, Lau E, Mowat F, Halpern M. Projections of primary and revision hip and knee arthroplasty in the United States from 2005 to 2030. J Bone Joint Surg Am. 2007;89:780-5 - PubMed
-
- Khatod M, Inacio M, Paxton EW, Bini SA, Namba RS, Burchette RJ, Fithian DC. Knee replacement: epidemiology, outcomes, and trends in Southern California: 17,080 replacements from 1995 through 2004. Acta Orthop. 2008;79:812-9 - PubMed
MeSH terms
Grants and funding
LinkOut - more resources
Full Text Sources
Medical
Miscellaneous
