

Inferring coancestry in population samples in the presence of linkage disequilibrium
- PMID: 22298700
- PMCID: PMC3316655
- DOI: 10.1534/genetics.111.137570
Inferring coancestry in population samples in the presence of linkage disequilibrium
Abstract
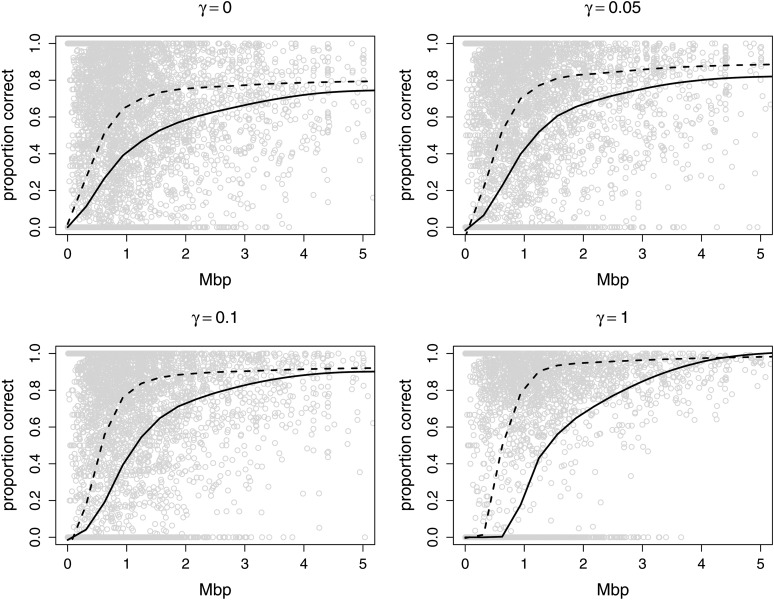
In both pedigree linkage studies and in population-based association studies there has been much interest in the use of modern dense genetic marker data to infer segments of gene identity by descent (ibd) among individuals not known to be related, to increase power and resolution in localizing genes affecting complex traits. In this article, we present a hidden Markov model (HMM) for ibd among a set of chromosomes and describe methods and software for inference of ibd among the four chromosomes of pairs of individuals, using either phased (haplotypic) or unphased (genotypic) data. The model allows for missing data and typing error, but does not model linkage disequilibrium (LD), because fitting an accurate LD model requires large samples from well-studied populations. However, LD remains a major confounding factor, since LD is itself a reflection of coancestry at the population level. To study the impact of LD, we have developed a novel simulation approach to generate realistic dense marker data for the same set of markers but at varying levels of LD. Using this approach, we present results of a study of the impact of LD on the sensitivity and specificity of our HMM model in estimating segments of ibd among sets of four chromosomes and between genotype pairs. We show that, despite not incorporating LD, our model has been quite successful in detecting segments as small as 10(6) bp (1 Mpb); we present also comparisons with fastIBD which uses an LD model in estimating ibd.
Figures
References
-
- Albrechtsen A., Korneliussen T. S., Moltke I., van Overseem Hansen T., Nielsen F. C., et al. , 2009. Relatedness mapping and tracts of relatedness for genome-wide data in the presence of linkage disequilibrium. Genet. Epidemiol. 33: 266–274 - PubMed
-
- Balding D. J., Nichols R. A., 1994. DNA profile match probability calculations: how to allow for population stratification, relatedness, database selection, and single bands. Forensic Sci. Int. 64: 125–140 - PubMed
-
- Baum L. E., Petrie T., Soules G., Weiss N., 1970. A maximization technique occurring in the statistical analysis of probabilistic functions on Markov chains. Ann. Math. Stat. 41: 164–171
Publication types
MeSH terms
Grants and funding
LinkOut - more resources
Full Text Sources
Research Materials
