. 2013 Jan;23(1):210-22.
doi: 10.1093/cercor/bhs008. Epub 2012 Jan 31.

Analysis of time and space invariance of BOLD responses in the rat visual system

Affiliations

Analysis of time and space invariance of BOLD responses in the rat visual system

Christopher J Bailey et al. Cereb Cortex. 2013 Jan.

Abstract

Neuroimaging studies of functional magnetic resonance imaging (fMRI) and electrophysiology provide the linkage between neural activity and the blood oxygenation level-dependent (BOLD) response. Here, BOLD responses to light flashes were imaged at 11.7T and compared with neural recordings from superior colliculus (SC) and primary visual cortex (V1) in rat brain--regions with different basal blood flow and energy demand. Our goal was to assess neurovascular coupling in V1 and SC as reflected by temporal/spatial variances of impulse response functions (IRFs) and assess, if any, implications for general linear modeling (GLM) of BOLD responses. Light flashes induced high magnitude neural/BOLD responses reproducibly from both regions. However, neural/BOLD responses from SC and V1 were markedly different. SC signals followed the boxcar shape of the stimulation paradigm at all flash rates, whereas V1 signals were characterized by onset/offset transients that exhibited different flash rate dependencies. We find that IRF(SC) is generally time-invariant across wider flash rate range compared with IRF(V1), whereas IRF(SC) and IRF(V1) are both space invariant. These results illustrate the importance of measured neural signals for interpretation of fMRI by showing that GLM of BOLD responses may lead to misinterpretation of neural activity in some cases.


Figures

Figure 1.
Figure 1.
BOLD and neural responses to light stimulation in the rat visual system. (A) BOLD activation maps from 2 trials of green light 1 Hz flash stimulation executed on the same animal (two-sample Student's t-test between 30 s baseline and 30 s stimulation periods, thresholded at P = 0.01, i.e., −log(P) = 4.6). Significant signal increases were observed in the middle cortical layers of the primary (V1) and secondary (V2) visual areas, and in the dorsal layers of the superior colliculus (SC). The z-coordinates between slices are relative to bregma (Paxinos and Watson 1998). (B) Single trial time courses of BOLD (top) and neural (bottom) responses to red, green, and blue light (1-Hz stimulation blocks). BOLD and MUA data from V1 (right) and SC (left) show color dependence, where close resemblance of BOLD and neural responses are observed with green and blue light. In comparison, red light induces weaker responses in both V1 and SC. The black horizontal bar below each plot marks the stimulation period (30 s). For illustration of the custom-made nondark adapted binocular stimulus delivery system and regional overlap of BOLD activation maps with different light colors, see Supplementary Figures 1 and 2, respectively.
Figure 2.
Figure 2.
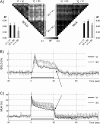
BOLD and neural temporal response profiles in V1 and SC differ significantly. (A) Trial-by-trial reproducibility analysis of 11 examples of BOLD and neural responses to 1-Hz flash stimulation (data from 6 animals). Each matrix, BOLD signal left, and MUA right, illustrates the R2-values for pairwise cross correlations between single trial time courses from the same region (V1 × V1 and SC × SC, i.e., intraregional) as well as those between time courses from different regions (V1 × SC, i.e., interregional). The adjacent bar graphs summarize these results, indicating higher correlations within a given region than between regions, due to different signal time courses in V1 and SC. (B and C) Average time courses (±SD) of BOLD signal and MUA measured from V1 (black) and SC (gray) for 1-Hz flash stimulation. The time courses of BOLD and MUA from V1 show a prominent onset peak, and a weaker but noticeable offset transient (arrows). The gray horizontal bar represents the stimulation period (30 s). For illustration of the corresponding LFP data, see Supplementary Figure 3.
Figure 3.
Figure 3.
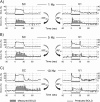
Higher flash rates induce variable BOLD and neural temporal response profiles in V1 and SC. Average time courses (±SD) of BOLD signal (top) and MUA (bottom) measured from V1 (black) and SC (gray) for (A) 5- and (B) 10-Hz flash rate stimulation (data from 6 animals). Data obtained at the higher flash rates of 5 Hz and 10 Hz demonstrate different dynamics from data obtained at 1 Hz. First, there are prominent offset responses from V1 in the BOLD and MUA data. Second, the plateau BOLD response from V1 is significantly attenuated at the10-Hz flash rate. Third, the BOLD and MUA data from SC do not show significant onset responses, but there are some offset responses at higher flash rates. For summary of neurovascular couplings and uncouplings for different flash rates in V1 and SC, see Table 1. The gray horizontal bar represents the stimulation period (30 s). For illustration of the corresponding LFP data, see Supplementary Figures 4 and 5.
Figure 4.
Figure 4.
Average IRFs for V1 and SC (i.e., IRFV1 and IRFSC represented by solid and dashed lines, respectively) obtained by deconvolution between single-trial BOLD and MUA data measured during 1 Hz stimulation (data from 6 animals). See text for details on the gamma variate function. IRFV1 and IRFSC peak at 2.5 ± 0.5 s and 2.0 ± 1.1 s, respectively, with widths at half height of 1.5 ± 0.4 s and 1.4 ± 0.3 s. The gray shading represents the SD of the estimated IRFs.
Figure 5.
Figure 5.
Comparison between measured and modeled BOLD responses to test the temporal invariance of modeled SC and V1 signals (i.e., IRFSC and IRFV1). Data for V1 and SC are shown in the right and left columns, respectively. Time courses of measured BOLD responses (lower panel, gray shade) for (A) 1-, (B) 5-, and (C) 10-Hz flash rates are juxtaposed against the time courses of modeled BOLD responses (lower panel, black trace), which were generated by convolution between the respective MUA responses (upper panel, black trace) and corresponding IRFs for 1 Hz stimulation for that region (Fig. 4). In other words, the modeled BOLD responses from V1 were obtained using IRFV1 and the modeled BOLD responses from SC were obtained using IRFSC. Good agreement between modeled and measured BOLD responses is found in SC at all flash rates examined, whereas only the 1 and 5 Hz responses are adequately modeled by IRFV1. See Supplementary Figure 6A,B for illustration of correspondence of measured and modeled signals from all animals. The black horizontal bar represents the stimulation period (30 s). Data from a single representative animal.
Figure 6.
Figure 6.
Comparison between measured and modeled BOLD responses to test the spatial invariance of IRFSC and IRFV1. Data for V1 and SC are shown in the right and left columns, respectively. Time courses of measured BOLD responses (lower panel, gray shade) for (A) 1-, (B) 5-, and (C) 10-Hz flash rates are juxtaposed against the time courses of modeled BOLD responses (lower panel, black trace), which were generated by convolution between the respective MUA responses (upper panel, black trace) and corresponding IRFs for 1 Hz stimulation for that region (Fig. 4). In other words, the modeled BOLD responses from V1 were obtained using IRFSC and the modeled BOLD responses from SC were obtained using IRFV1. See Supplementary Figure 6C,D for illustration of space-invariant IRF analysis from all animals. The black horizontal bar represents the stimulation period (30 s). Data from a different representative animal from that in Figure 5.
Figure 7.
Figure 7.
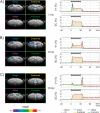
Comparison between experimentally measured BOLD responses and modeled BOLD responses created from GLM. Time courses (right column) of measured BOLD responses (pink shade) from V1 (top trace) and SC (bottom trace) for (A) 1-, (B) 5-, and (C) 10-Hz flash rates are juxtaposed with the BOLD activation maps (left column) for the 4 phases of the response: onset, sustained, offset, and poststimulation. The modeled BOLD responses were generated by summing the time courses generated from GLM of the 4 components, where the canonical HRF used for GLM was the average of IRFSC and IRFV1 (in Fig. 4), but very similar results are obtained if either of IRFSC and IRFV1 is used (data not shown). The gray horizontal bar represents the stimulation period (30 s). Data from a single representative animal; for summary statistics for 6 animals, see Table 2. poststimulation.

References

    1. Berwick J, Johnston D, Jones M, Martindale J, Martin C, Kennerley AJ, Redgrave P, Mayhew JE. Fine detail of neurovascular coupling revealed by spatiotemporal analysis of the hemodynamic response to single whisker stimulation in rat barrel cortex. J Neurophysiol. 2008;99:787–798. - PMC - PubMed
    1. Binns KE. The synaptic pharmacology underlying sensory processing in the superior colliculus. Prog Neurobiol. 1999;59:129–159. - PubMed
    1. Birn RM, Saad ZS, Bandettini PA. Spatial heterogeneity of the nonlinear dynamics in the FMRI BOLD response. Neuroimage. 2001;14:817–826. - PubMed
    1. Borowsky IW, Collins RC. Metabolic anatomy of brain: a comparison of regional capillary density, glucose metabolism, and enzyme activities. J Comp Neurol. 1989;288:401–413. - PubMed
    1. Boynton GM, Engel SA, Glover GH, Heeger DJ. Linear systems analysis of functional magnetic resonance imaging in human V1. J Neurosci. 1996;16:4207–4221. - PMC - PubMed

Publication types