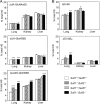
. 2012 Mar 16;287(12):9579-90.
doi: 10.1074/jbc.M111.290262. Epub 2012 Feb 1.

Organ-specific sulfation patterns of heparan sulfate generated by extracellular sulfatases Sulf1 and Sulf2 in mice

Affiliations

Organ-specific sulfation patterns of heparan sulfate generated by extracellular sulfatases Sulf1 and Sulf2 in mice

Satoshi Nagamine et al. J Biol Chem. .

Abstract

Heparan sulfate endosulfatases Sulf1 and Sulf2 hydrolyze 6-O-sulfate in heparan sulfate, thereby regulating cellular signaling. Previous studies have revealed that Sulfs act predominantly on UA2S-GlcNS6S disaccharides and weakly on UA-GlcNS6S disaccharides. However, the specificity of Sulfs and their role in sulfation patterning of heparan sulfate in vivo remained unknown. Here, we performed disaccharide analysis of heparan sulfate in Sulf1 and Sulf2 knock-out mice. Significant increases in ΔUA2S-GlcNS6S were observed in the brain, small intestine, lung, spleen, testis, and skeletal muscle of adult Sulf1(-/-) mice and in the brain, liver, kidney, spleen, and testis of adult Sulf2(-/-) mice. In addition, increases in ΔUA-GlcNS6S were seen in the Sulf1(-/-) lung and small intestine. In contrast, the disaccharide compositions of chondroitin sulfate were not primarily altered, indicating specificity of Sulfs for heparan sulfate. For Sulf1, but not for Sulf2, mRNA expression levels in eight organs of wild-type mice were highly correlated with increases in ΔUA2S-GlcNS6S in the corresponding organs of knock-out mice. Moreover, overall changes in heparan sulfate compositions were greater in Sulf1(-/-) mice than in Sulf2(-/-) mice despite lower levels of Sulf1 mRNA expression, suggesting predominant roles of Sulf1 in heparan sulfate desulfation and distinct regulation of Sulf activities in vivo. Sulf1 and Sulf2 mRNAs were differentially expressed in restricted types of cells in organs, and consequently, the sulfation patterns of heparan sulfate were locally and distinctly altered in Sulf1 and Sulf2 knock-out mice. These findings indicate that Sulf1 and Sulf2 differentially contribute to the generation of organ-specific sulfation patterns of heparan sulfate.


Figures
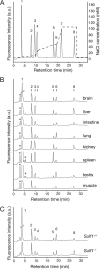
FIGURE 1.
FIGURE 1.
Chromatograms of HS unsaturated disaccharides. A, a chromatogram of eight standard HS disaccharides is shown. 1, ΔUA-GlcNAc; 2, ΔUA-GlcNS; 3, ΔUA-GlcNAc6S; 4, ΔUA2S-GlcNAc; 5, ΔUA-GlcNS6S; 6, ΔUA2S-GlcNS; 7, ΔUA2S-GlcAc6S; 8, ΔUA2S-GlcNS6S. The dotted line indicates NaCl concentration. B, representative chromatograms of HS disaccharides from eight organs of wild-type mice are shown. Asterisks indicate peaks of unknown origin. C, the chromatograms of HS disaccharides from Sulf1+/+ and Sulf1−/− lungs are shown. The Sulf1−/− lung contains higher ΔUA2S-GlcNS6S (peak 8) and lower ΔUA2S-GlcNS (peak 6) than those from wild-type controls. a.u., arbitrary units.
FIGURE 2.
FIGURE 2.
Changes in 6-O-sulfated HS disaccharide units in Sulf knock-out mice. Percentages of ΔUA-GlcNAc6S, ΔUA-GlcNS6S, and ΔUA2S-GlcNS6S in total HS of Sulf1−/− (A) and Sulf2−/− (B) mice are shown. Br, brain; Li, liver; In, small intestine; Lu, lung; Ki, kidney; Sp, spleen; Te, testis; Mu, muscle. Bars indicate means ± S.E. Statistical significance compared with the wild-type controls (unpaired t test; *, p < 0.05; **, p < 0.01; ***, p < 0.001) is shown. Refer to Tables 1 and 2 for the numbers of mice examined and the values for each disaccharide composition.
FIGURE 3.
FIGURE 3.
Correlation between Sulf mRNA expression and changes in HS sulfation patterns in Sulf knock-out mouse organs. The levels of Sulf1 or Sulf2 mRNA expression in eight organs of wild-type mice were quantitatively determined and normalized to Gapdh expression. Increase in ΔUA2S-GlcNS6S in Sulf1 or Sulf2 knock-out as compared with wild-type controls (%) was calculated. Sulf1 expression in wild-type mice and increase in ΔUA2S-GlcNS6S in Sulf1 knock-out mice (A) and Sulf2 expression in the wild-type mice and increase in ΔUA2S-GlcNS6S in Sulf2 knock-out mice (B) in eight organs are plotted. The insets show magnifications of the low expression regions. Sulf1 expression was highly correlated with the increase in ΔUA2S-GlcNS6S in Sulf1 knock-out mice (R = 0.88).
FIGURE 4.
FIGURE 4.
Changes in 6-O-sulfated disaccharide units in neonatal Sulf knock-out mice. Percentages of ΔUA-GlcNAc6S, ΔUA-GlcNS6S, and ΔUA2S-GlcNS6S in total HS (A) and percentages of ΔDi-6S and ΔDi-diSE in total CS (B) in wild-type, Sulf1 knock-out, Sulf2 knock-out, and Sulf1/2 double knock-out mice are shown. Bars indicate the means ± S.E. Analysis of variance with the Bonferroni post hoc test was performed for each organ, and statistical significance was compared with the wild-type controls (*, p < 0.05; **, p < 0.01; ***, p < 0.001) is shown. Refer to Table 3 for the numbers of mice examined and values for each disaccharide composition.
FIGURE 5.
FIGURE 5.
In situ hybridization of Sulf1 and Sulf2. Cryostat sections of the adult lung (A and B), kidney (C and D), and testis (E and F) were hybridized with digoxigenin-labeled RNA probes specific to Sulf1 (A, C, and E) or Sulf2 (B, D, and F). The signals were detected by BM purple. Arrows in C and D indicate expression of Sulf1 in glomeruli and Sulf2 in distal renal tubules, respectively. Asterisks in E and F indicate the seminiferous tubules containing Sertoli cells expressing Sulf1 and Sulf2, respectively. b, bronchus; p, pulmonary artery. Scale bar, 100 μm.
FIGURE 6.
FIGURE 6.
Immunohistochemistry of HS in adult kidneys. Cryostat sections of the adult kidneys from wild-type (A and D), Sulf1−/− (B and E), and Sulf2−/− (C and F) mice were incubated with anti-HS antibodies RB4CD12 (A–C) or AO4B08 (D–F). The antibody binding was detected by incubation with anti-Myc (A–C) or anti-VSV-G (D–F) antibodies and then by incubation with Alexa568-conjugated anti-rabbit IgG antibody. Asterisks indicate glomeruli. Scale bar, 50 μm.
FIGURE 7.
FIGURE 7.
Immunohistochemistry of HS in neonatal lungs. Cryostat sections of the neonatal lungs from wild-type (A and E), Sulf1−/− (B and F), Sulf2−/− (C and G), and Sulf1−/−; Sulf2−/− (D and H) mice were incubated with anti-HS antibodies RB4CD12 (A–D) or AO4B08 (E–H). The antibody binding was detected by incubation with anti-Myc (A–D) or anti-VSV-G (E–H) antibodies and then by incubation with Alexa568-conjugated anti-rabbit IgG antibody. b, bronchus; v, blood vessels. Scale bar, 50 μm.

References

    1. Lindahl U., Kusche-Gullberg M., Kjellén L. (1998) Regulated diversity of heparan sulfate. J. Biol. Chem. 273, 24979–24982 - PubMed
    1. Bernfield M., Götte M., Park P. W., Reizes O., Fitzgerald M. L., Lincecum J., Zako M. (1999) Functions of cell surface heparan sulfate proteoglycans. Annu. Rev. Biochem. 68, 729–777 - PubMed
    1. Gallagher J. T. (2001) Heparan sulfate. Growth control with a restricted sequence menu. J. Clin. Invest. 108, 357–361 - PMC - PubMed
    1. Turnbull J., Powell A., Guimond S. (2001) Heparan sulfate: decoding a dynamic multifunctional cell regulator. Trends Cell Biol. 11, 75–82 - PubMed
    1. Esko J. D., Selleck S. B. (2002) Order out of chaos. Assembly of ligand binding sites in heparan sulfate. Annu. Rev. Biochem. 71, 435–471 - PubMed

Publication types

MeSH terms

LinkOut - more resources