. 2012;7(1):e30075.
doi: 10.1371/journal.pone.0030075. Epub 2012 Jan 27.

BMP-9 induced endothelial cell tubule formation and inhibition of migration involves Smad1 driven endothelin-1 production

Affiliations

BMP-9 induced endothelial cell tubule formation and inhibition of migration involves Smad1 driven endothelin-1 production

John E S Park et al. PLoS One. 2012.

Abstract

Background: Bone morphogenetic proteins (BMPs) and their receptors, such as bone morphogenetic protein receptor (BMPR) II, have been implicated in a wide variety of disorders including pulmonary arterial hypertension (PAH). Similarly, endothelin-1 (ET-1), a mitogen and vasoconstrictor, is upregulated in PAH and endothelin receptor antagonists are used in its treatment. We sought to determine whether there is crosstalk between BMP signalling and the ET-1 axis in human pulmonary artery endothelial cells (HPAECs), possible mechanisms involved in such crosstalk and functional consequences thereof.

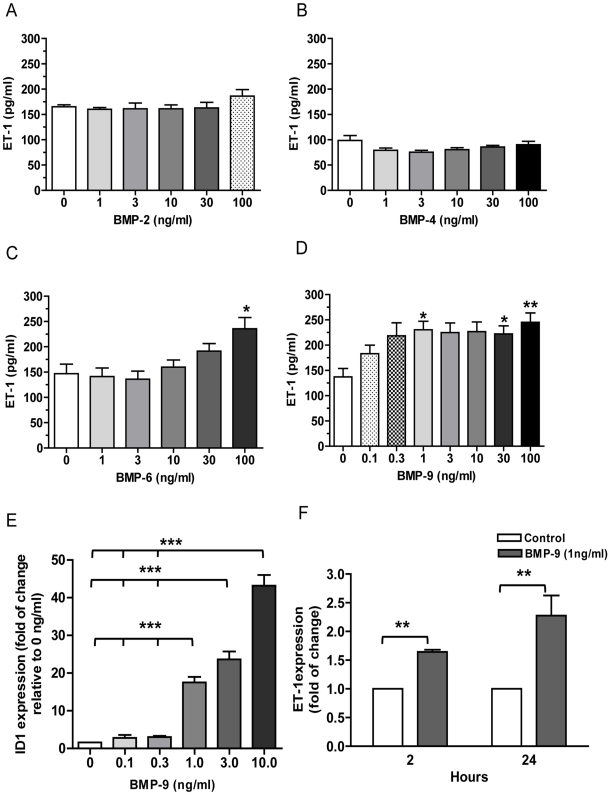
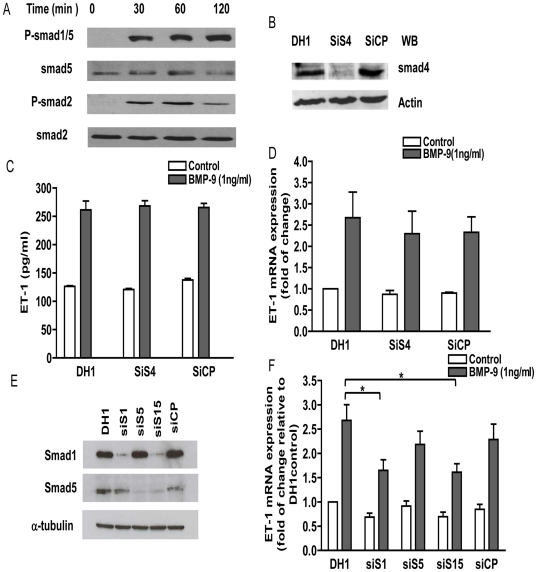
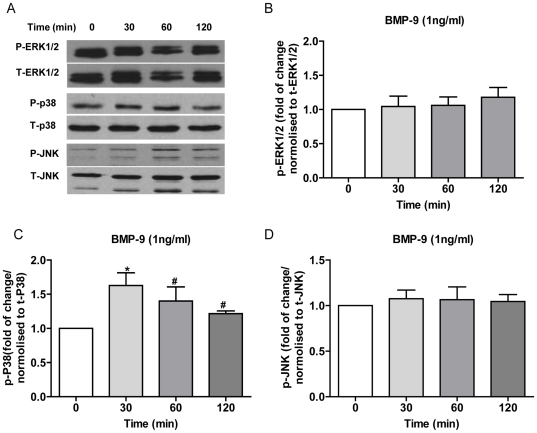
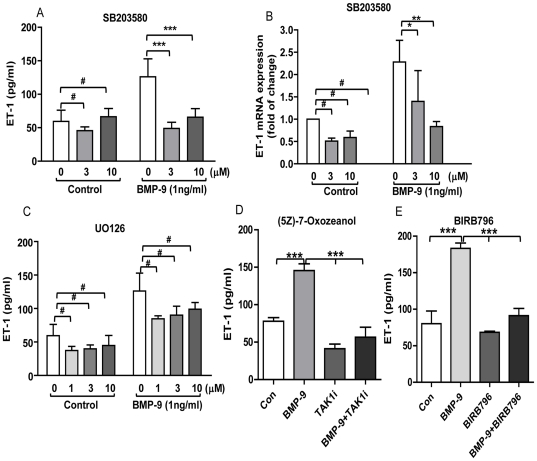
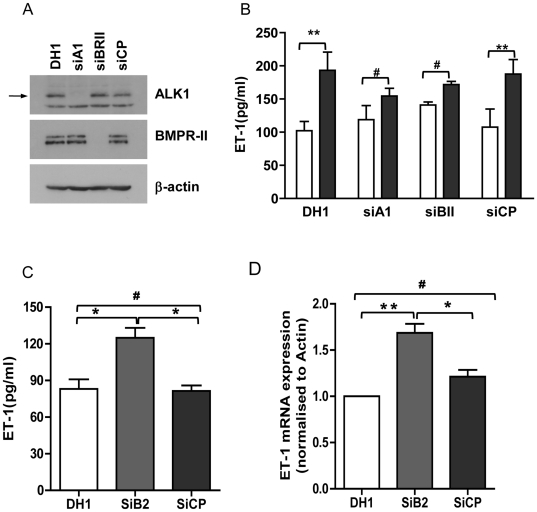
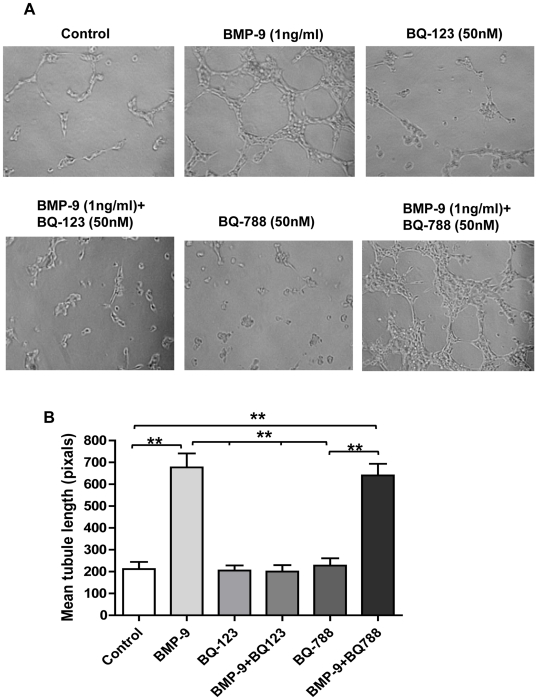
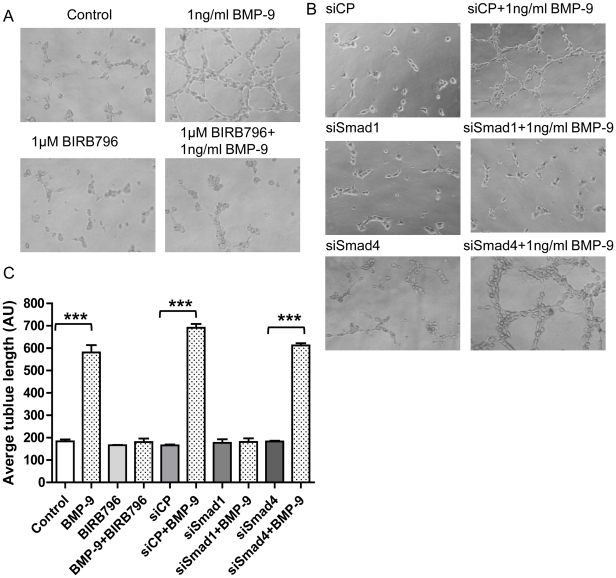
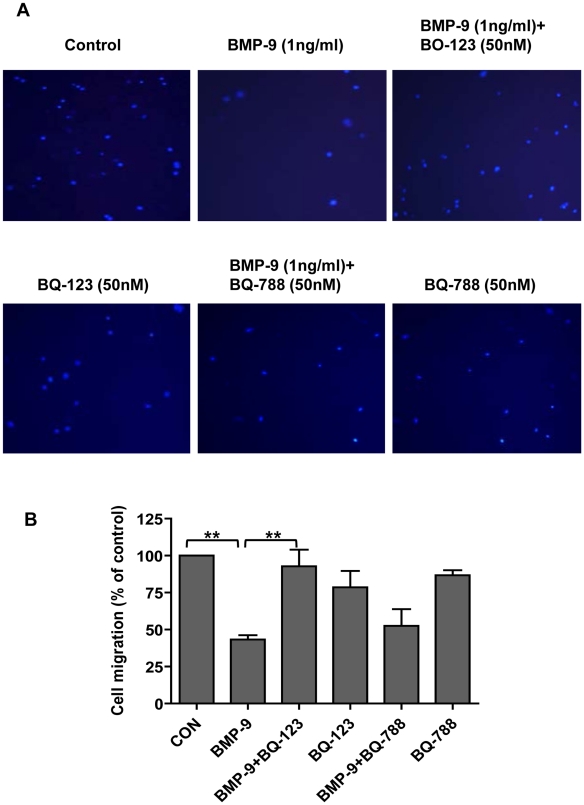
Methodology/principal finding: Using western blot, real time RT-PCR, ELISA and small RNA interference methods we provide evidence that in HPAECs BMP-9, but not BMP-2, -4 and -6 significantly stimulated ET-1 release under physiological concentrations. This release is mediated by both Smad1 and p38 MAPK and is independent of the canonical Smad4 pathway. Moreover, knocking down the ALK1 receptor or BMPR II attenuates BMP-9 stimulated ET-1 release, whilst causing a significant increase in prepro ET-1 mRNA transcription and mature peptide release. Finally, BMP-9 induced ET-1 release is involved in both inhibition of endothelial cell migration and promotion of tubule formation.

Conclusions/significance: Although our data does not support an important role for BMP-9 as a source of increased endothelial ET-1 production seen in human PAH, BMP-9 stimulated ET-1 production is likely to be important in angiogenesis and vascular stability. However, increased ET-1 production by endothelial cells as a consequence of BMPR II dysfunction may be clinically relevant in the pathogenesis of PAH.


Conflict of interest statement

Competing Interests: The authors have declared that no competing interests exist.

Figures

Figure 1
Figure 1. ET-1 release in response to BMPs and ET-1 mRNA expression by BMP-9 stimulation.
HPAECs were grown to confluence on 96-well plates or 6-well plates and starved for 16 hrs. Cells were then stimulated with various concentrations of BMP-2, n = 4 (A), BMP-4, n = 7 (B), BMP-6, n = 5 (C) or BMP-9, n = 6 (D). Supernatants were collected at 24 hrs of treatment and ET-1 level assayed by ELISA. RNA was extracted from cells treated with increasing concentration of BMP-9 for 24 hrs. Id-1 gene expression was determined by qRT-PCR and normalised to the average of 2 housekeeping genes and shown relative to expression of non-stimulated controls, n = 3 (E). RNA was extracted from cells treated with 1 ng/ml BMP-9 at 2 hrs and 24 hrs time points and ET-1 gene expression determined by qRT-PCR. ET-1 was normalised to the average of 2 housekeeping genes and shown relative to expression of non-stimulated controls at 2 hr and 24 hs, n = 4 (F). Data are presented as mean ± SEM. *p<0.05, **p<0.01, *** p<0.001.
Figure 2
Figure 2. Effects of Smad signalling pathway on BMP-9 induced prepro ET-1 mRNA transcription and ET-1 release.
HPAECs were grown to confluence in 6-cm dishes, starved for 16 hrs and then stimulated with BMP-9 (1 ng/ml). Phosphorylation of Smad1/5 and Smad2 were determined by western blot (A). After transfected with Smad4 specific or non-targeting siRNA and starved for 16 hs, HPAECs were stimulated with BMP-9 (1 ng/ml). The knockdown efficiency was determined by western blotting (B). After siRNA treatment and BMP-9 stimulation, supernatants and cells were collected at 24 hrs (6-well plates) for determination of ET-1 peptides by ELISA, n = 4 (C) and mRNA levels by qRT-PCR, n = 4 (D). HPAECs were transfected with Smad1, Smad5 or non-targeting siRNA. Specific Smad1 and Smad5 knockdown were confirmed by qRT-PCR (not shown) and western blotting (E). After siRNA treatment, HPAECs were starved and stimulated with BMP-9 (1 ng/ml) for 24 hrs. RNA was extracted and gene expression determined by qRT-PCR. ET-1 was normalised to β-actin and is expressed relative to cells exposed to DH1 only, n = 5 (F). Data are presented as mean ± SEM. **p<0.01.
Figure 3
Figure 3. ERK1/2, JNK and p38 MAPK phosphorylation in HPAECs stimulated with BMP-9.
HPAECs were grown to confluence in 6-cm dishes, starved for 16 hrs and then stimulated with BMP-9 (1 ng/ml). Phosphorylation of ERK1/2, JNK and p38 MAPK were determined by western blot (A), and quantified by densitometry (B, C and D). Data are presented as mean ± SEM. n = 3, #p>0.05; *p<0.05, one -way ANOVA, control vs. BMP-9 stimulation.
Figure 4
Figure 4. Effects of p38 MAPK and ERK1/2 inhibition on BMP-9 stimulated prepro ET-1 mRNA transcription and ET-1 release.
HPAECs were grown to confluence, starved for 16 hrs and then pre-incubated with 1–10 µM SB203580, 1–10 µM UO126, 0.5 µM (5Z)-7-Oxozeanol or 1 µM BIRB796 for 60 min before adding BMP-9 (1 ng/ml) for another 24 hrs. Supernatants and cells were collected for determination of ET-1 by ELISA n = 4 (A, C, D, E), and prepro ET-1 mRNA levels by qRT-PCR, n = 3 (B). Data are presented as mean ± SEM. #p>0.05; * p<0.05; **p<0.01; ***p<0.001.
Figure 5
Figure 5. Effects of ALK1 and BMPR II siRNA on BMP-9 induced ET-1 release.
HPAECs were transfected with ALK1, BMPR II specific or non-targeting siRNA. Cells were starved for 16 hrs and stimulated with BMP-9 (1 ng/ml) for 24 hrs. Knock-down efficiency was determined by western blotting. The arrows denote ALK1 (62 kDa) and BMPR II (doublet 190 kDa and 145 kDa) (A). Supernatants were collected at 24 hrs post-stimulation for determination of ET-1 release by ELISA (B&C). RNA was extracted from HPAECs treated with BMPR II specific siRNA and gene expression was determined by qRT-PCR (D). Data are presented as Mean ± SEM, n = 4. #p>0.05; **p<0.01.
Figure 6
Figure 6. Effect of BMP-9 induced ET-1 release on HPAEC tubule formation.
HPAECs were seeded onto matrigel and tubule formation capacity analysed as described in the materials and methods section. Representitive images of 3 independent experiments of tubule formation are shown in (A). The average length of the tublule networks in the various conditions shown was quantified using Image J (NIH) and represented graphically in (B). Data are presented as mean ± SEM, n = 3. **p<0.01.
Figure 7
Figure 7. Effect of p38 MAPK inhibition and Smad1/Smad4 knock-down on BMP-9 induced HPAEC tubule formation.
HPAECs or HPAECs transfected with negative control (CP), Smad1 and Smad4 siRNA were seeded onto matrigel and tubule formation capacity analysed as described in the materials and methods section. Representitive images of 3 independent experiments of tubule formation are shown in (A&B). The average length of the tublule networks in the various conditions shown was quantified using Image J (NIH) and represented graphically in (C). Data are presented as mean ± SEM, n = 3. ***p<0.001.
Figure 8
Figure 8. Effect of BMP-9 induced ET-1 on HPAEC migration.
HPAECs were seeded onto transwell inserts and migration determined as described in the materials and methods section. Representitive images of 3 independent experiments of cells (nuclei identified with DAPI staining) migrated to the lower chamber are shown in (A). Migrated cells, under the conditions described shown, were counted and expressed graphically, as the percentage of the control in (B). Data are presented as mean ± SEM, n = 3. **p<0.01.

References

    1. Zeng S, Chen J, Shen H. Controlling of bone morphogenetic protein signaling. Cell Signal. 2010;22:888–893. - PubMed
    1. Upton PD, Davies RJ, Trembath RC, Morrell NW. Bone morphogenetic protein (BMP) and activin type II receptors balance BMP9 signals mediated by activin receptor-like kinase-1 in human pulmonary artery endothelial cells. J Biol Chem. 2009;284:15794–15804. - PMC - PubMed
    1. Huang MS, Morony S, Lu J, Zhang Z, Bezouglaia O, et al. Atherogenic phospholipids attenuate osteogenic signaling by BMP-2 and parathyroid hormone in osteoblasts. J Biol Chem. 2007;282:21237–21243. - PMC - PubMed
    1. Kimura N, Matsuo R, Shibuya H, Nakashima K, Taga T. BMP2-induced apoptosis is mediated by activation of the TAK1-p38 kinase pathway that is negatively regulated by Smad6. J Biol Chem. 2000;275:17647–17652. - PubMed
    1. Su D, Peng X, Zhu S, Huang Y, Dong Z, et al. Role of p38 MAPK pathway in BMP4-mediated Smad-dependent premature senescence in lung cancer cells. Biochem J. 2010;433:333–343. - PubMed

Publication types

MeSH terms