

Early metabolic markers that anticipate loss of insulin independence in type 1 diabetic islet allograft recipients
- PMID: 22300172
- PMCID: PMC4569145
- DOI: 10.1111/j.1600-6143.2011.03947.x
Early metabolic markers that anticipate loss of insulin independence in type 1 diabetic islet allograft recipients
Abstract
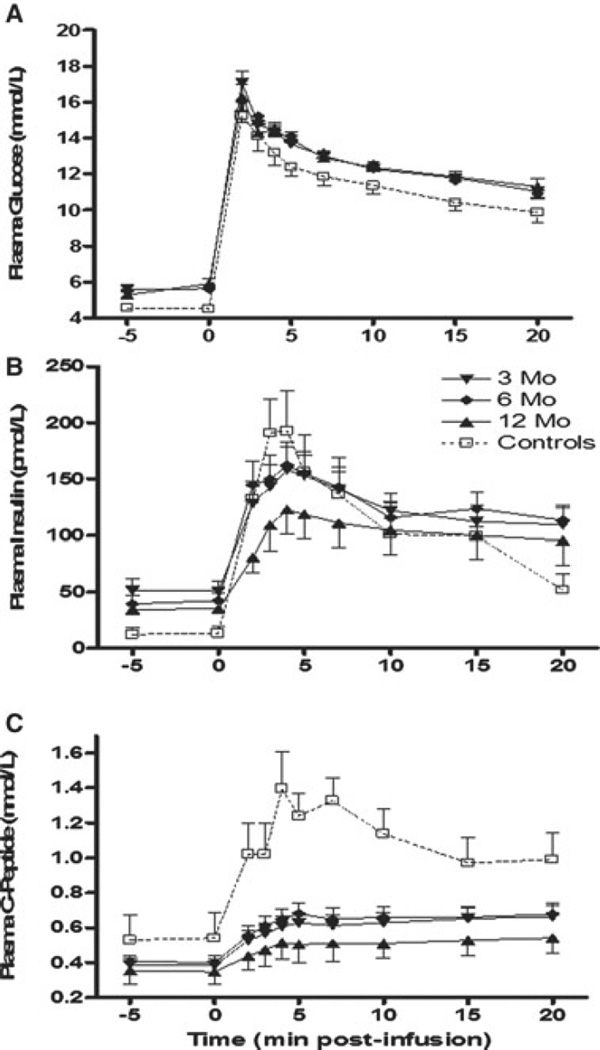
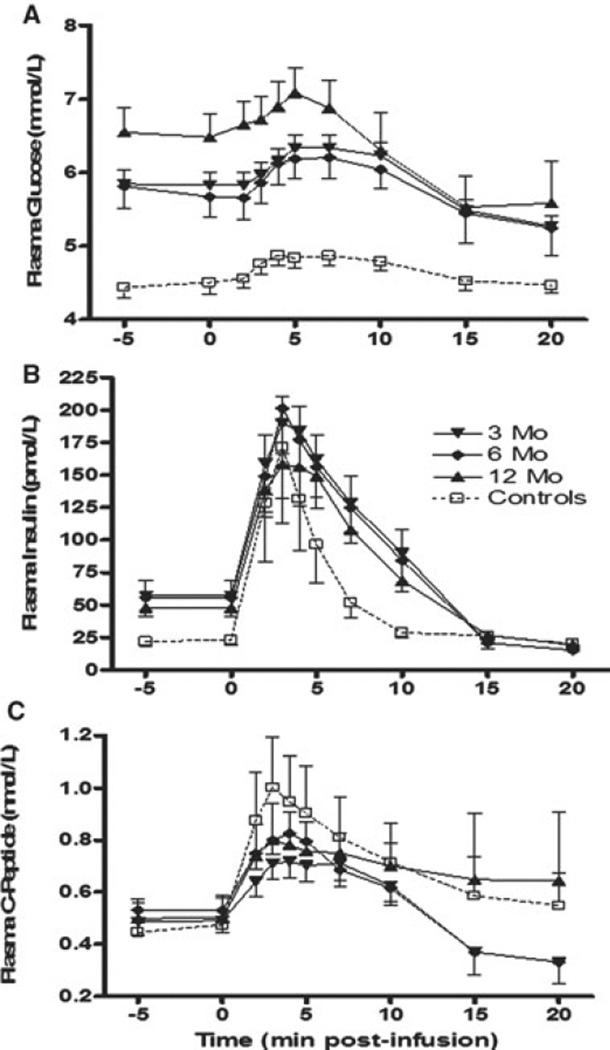
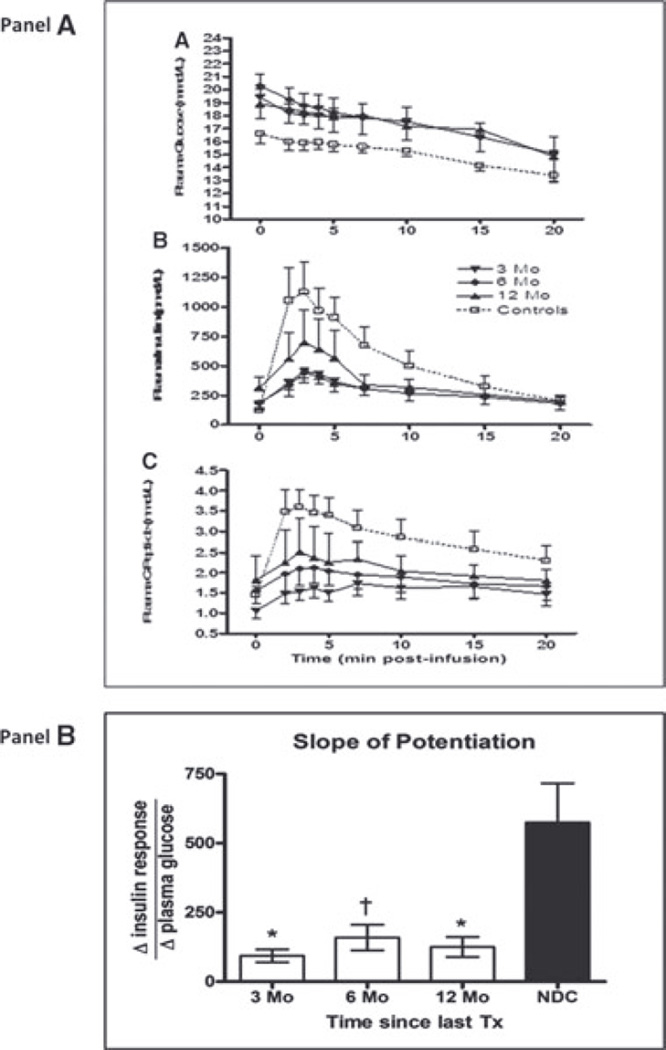
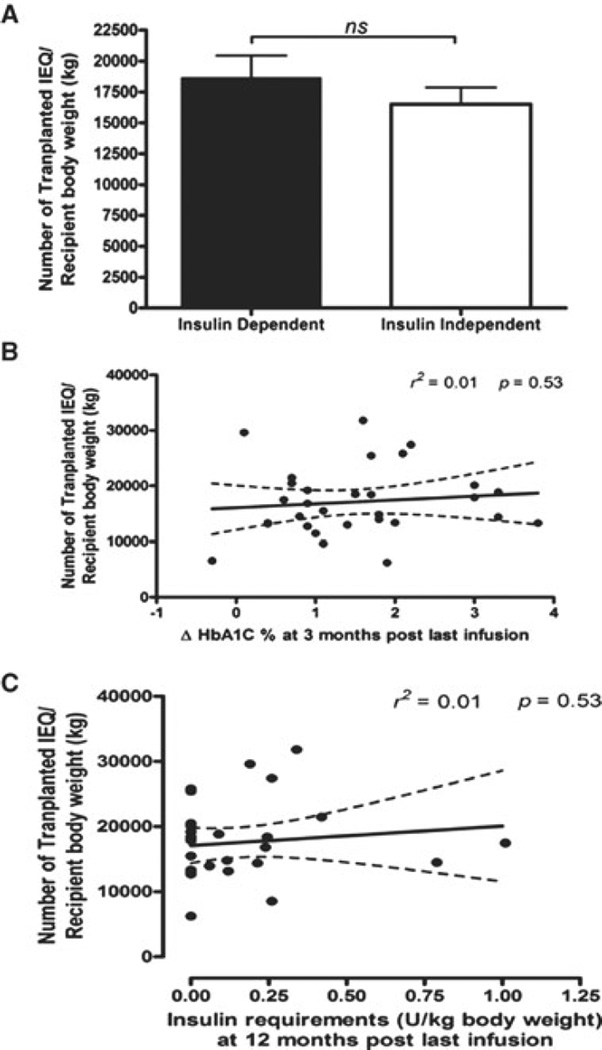
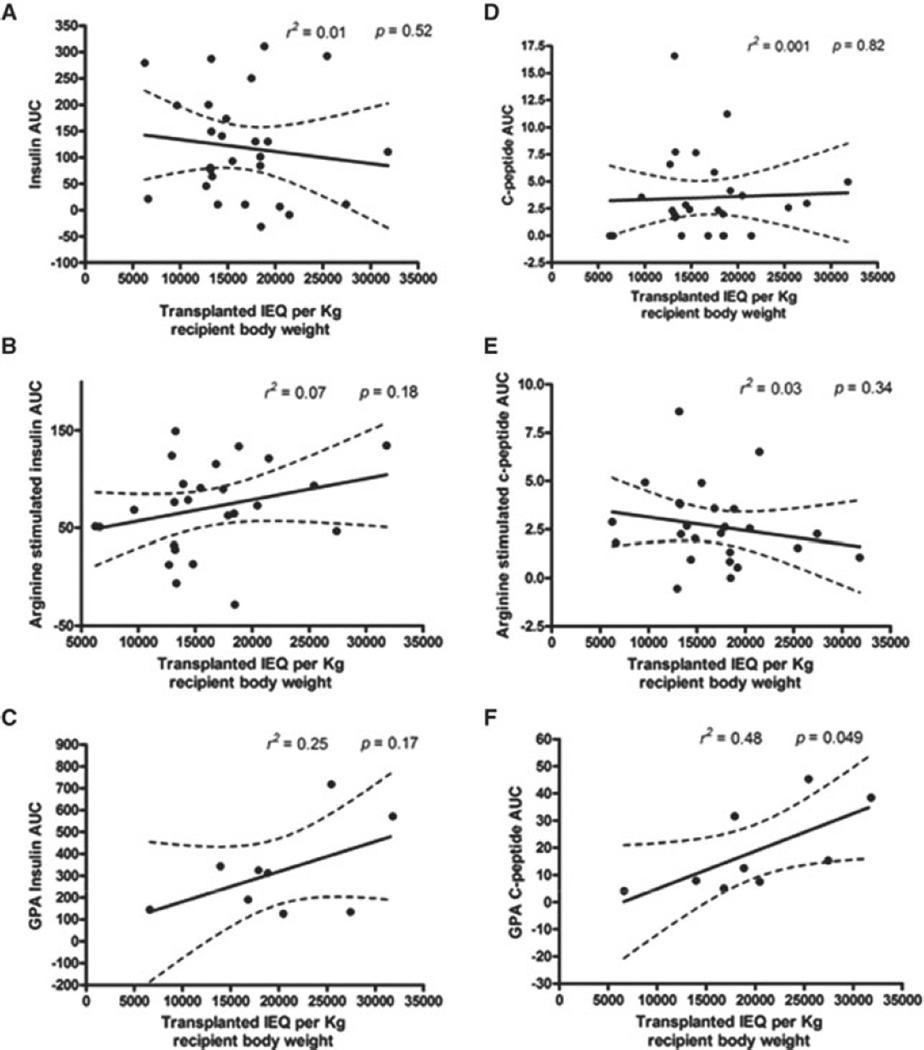
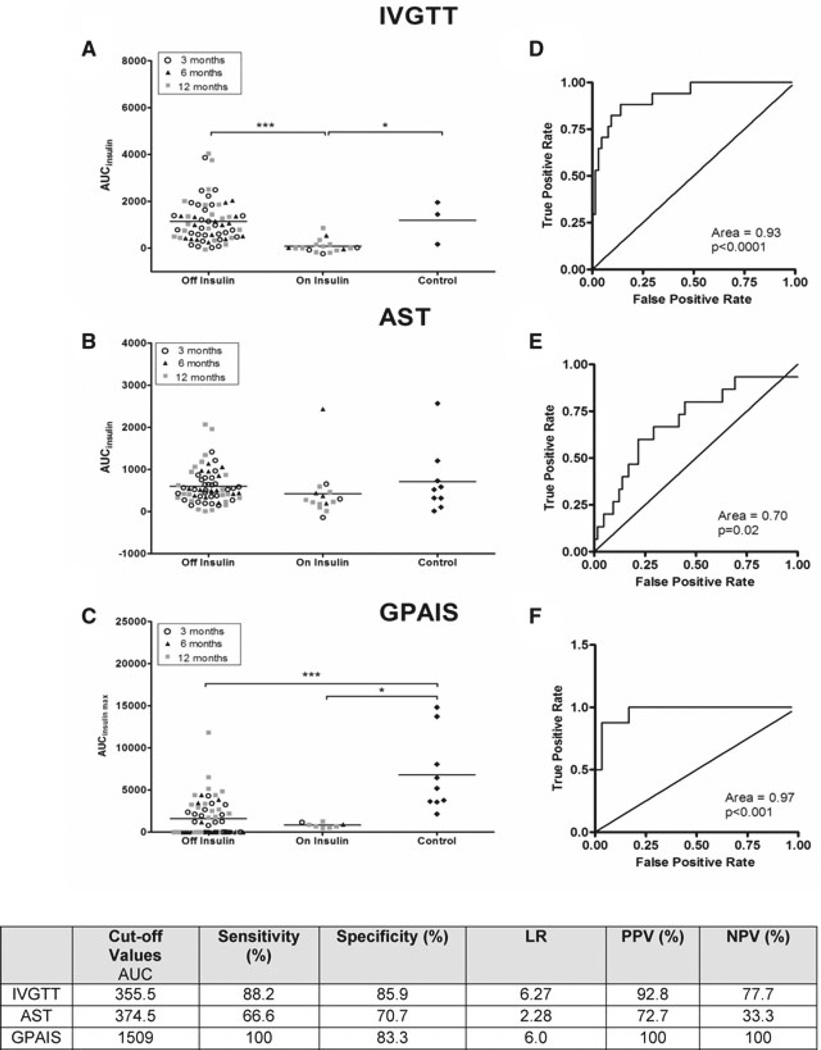
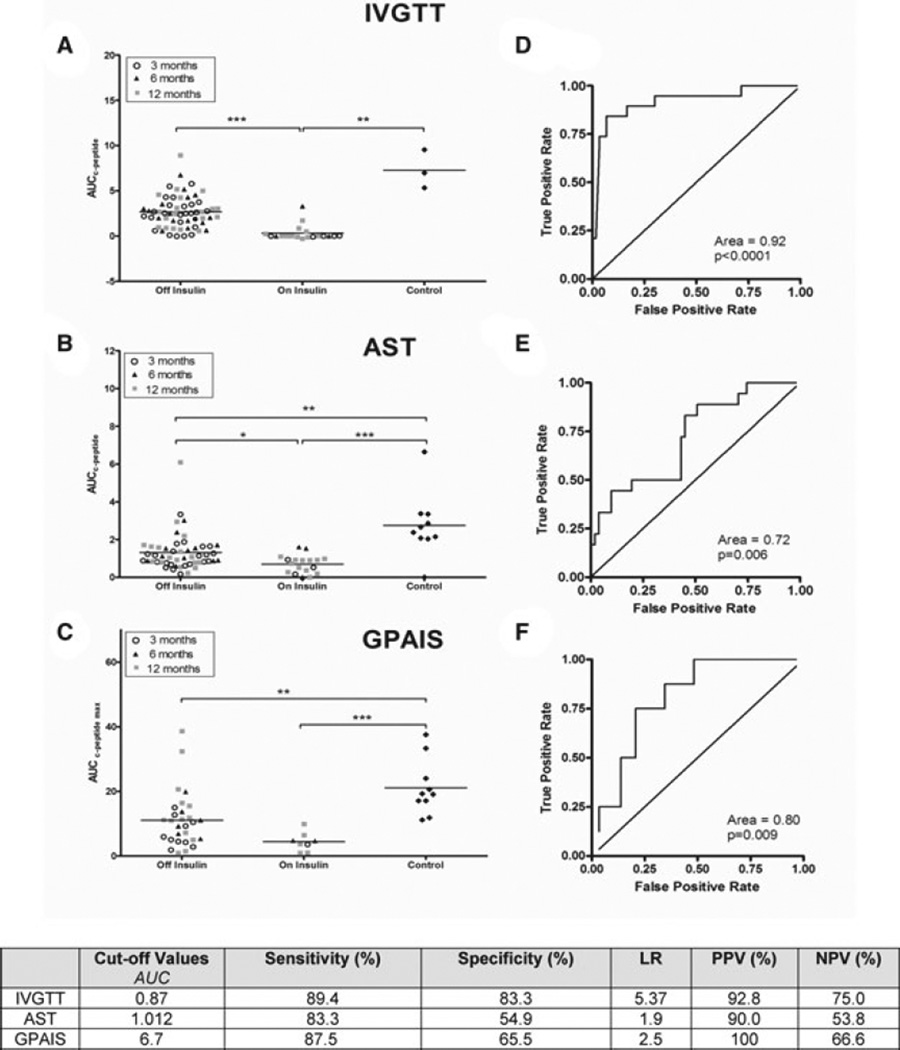
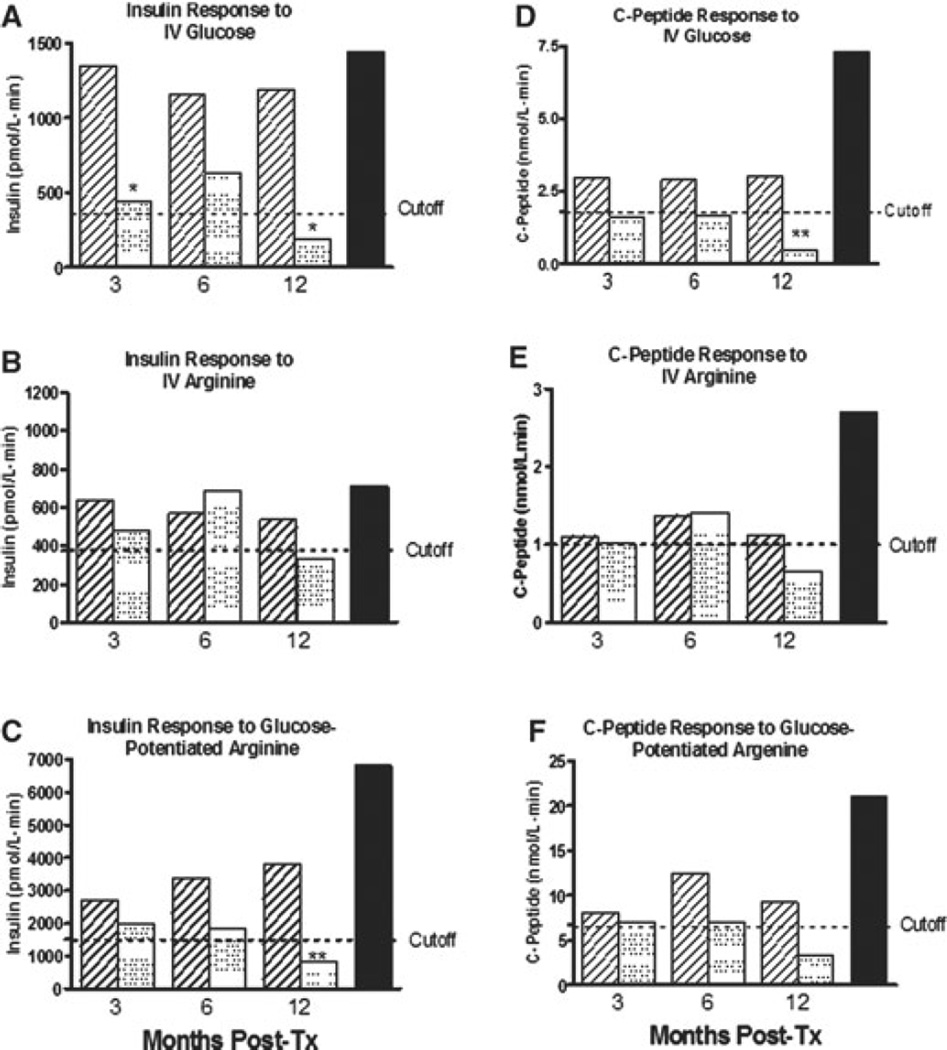
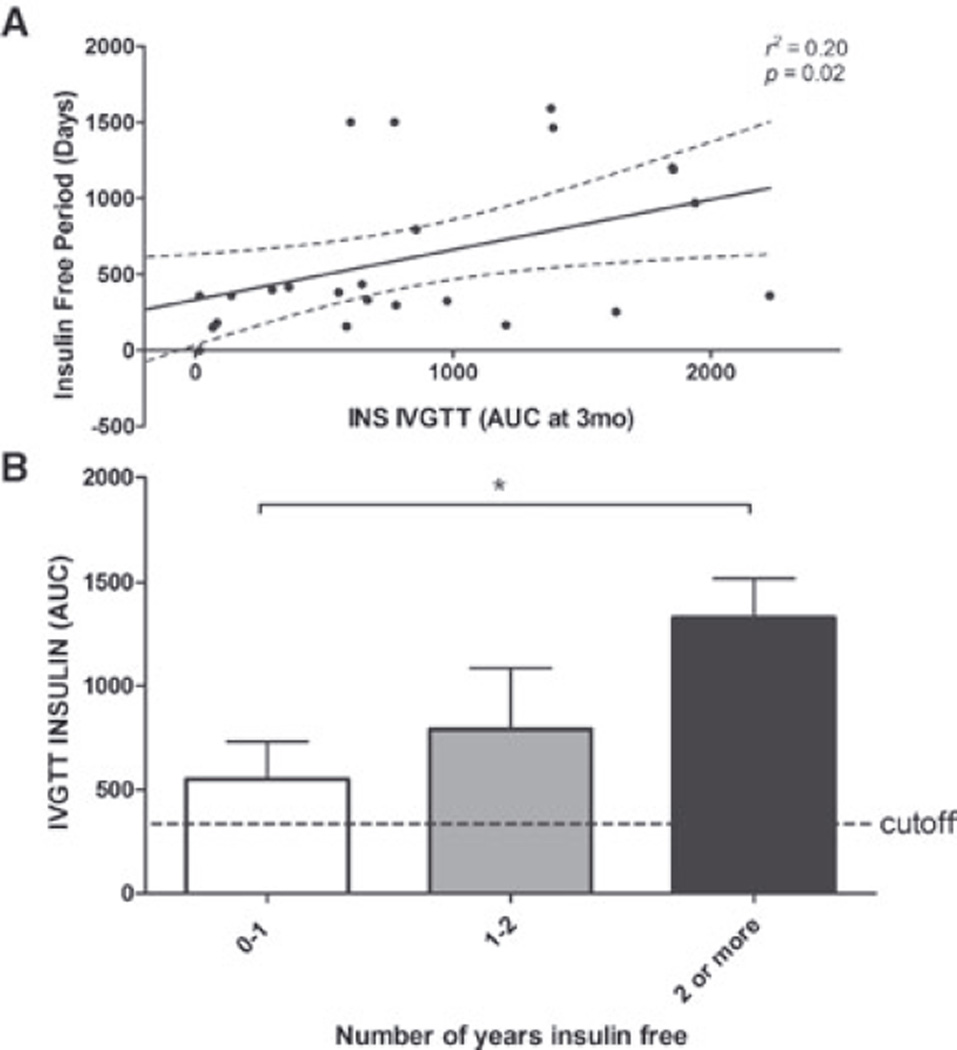
The objective of this study was to identify predictors of insulin independence and to establish the best clinical tools to follow patients after pancreatic islet transplantation (PIT). Sequential metabolic responses to intravenous (I.V.) glucose (I.V. glucose tolerance test [IVGTT]), arginine and glucose-potentiated arginine (glucose-potentiated arginine-induced insulin secretion [GPAIS]) were obtained from 30 patients. We determined the correlation between transplanted islet mass and islet engraftment and tested the ability of each assay to predict return to exogenous insulin therapy. We found transplanted islet mass within an average of 16 709 islet equivalents per kg body weight (IEQ/kg BW; range between 6602 and 29 614 IEQ/kg BW) to be a poor predictor of insulin independence at 1 year, having a poor correlation between transplanted islet mass and islet engraftment. Acute insulin response to IVGTT (AIR(GLU) ) and GPAIS (AIR(max) ) were the most accurate methods to determine suboptimal islet mass engraftment. AIR(GLU) performed 3 months after transplant also proved to be a robust early metabolic marker to predict return to insulin therapy and its value was positively correlated with duration of insulin independence. In conclusion, AIR(GLU) is an early metabolic assay capable of anticipating loss of insulin independence at 1 year in T1D patients undergoing PIT and constitutes a valuable, simple and reliable method to follow patients after transplant.
© Copyright 2012 The American Society of Transplantation and the American Society of Transplant Surgeons.
Conflict of interest statement
The authors of this manuscript have no conflicts of interest to disclose as described by the
Figures
Similar articles
-
Achievement of insulin independence in three consecutive type-1 diabetic patients via pancreatic islet transplantation using islets isolated at a remote islet isolation center.Transplantation. 2002 Dec 27;74(12):1761-6. doi: 10.1097/00007890-200212270-00020. Transplantation. 2002. PMID: 12499894
-
Early metabolic markers of islet allograft dysfunction.Transplantation. 2009 Mar 15;87(5):689-97. doi: 10.1097/TP.0b013e318195c249. Transplantation. 2009. PMID: 19295313 Free PMC article.
-
Clinical outcomes and insulin secretion after islet transplantation with the Edmonton protocol.Diabetes. 2001 Apr;50(4):710-9. doi: 10.2337/diabetes.50.4.710. Diabetes. 2001. PMID: 11289033
-
Clinical islet transplantation: where immunity and metabolism intersect?Curr Opin Endocrinol Diabetes Obes. 2012 Aug;19(4):249-54. doi: 10.1097/MED.0b013e328355a2ec. Curr Opin Endocrinol Diabetes Obes. 2012. PMID: 22647539 Review.
-
SUITO index for evaluation of clinical islet transplantation.Cell Transplant. 2012;21(7):1341-7. doi: 10.3727/096368912X636885. Cell Transplant. 2012. PMID: 22472135 Free PMC article. Review.
Cited by
-
Insulin sensitivity index in type 1 diabetes and following human islet transplantation: comparison of the minimal model to euglycemic clamp measures.Am J Physiol Endocrinol Metab. 2014 May 15;306(10):E1217-24. doi: 10.1152/ajpendo.00667.2013. Epub 2014 Apr 1. Am J Physiol Endocrinol Metab. 2014. PMID: 24691031 Free PMC article.
-
Continuous glucose monitoring after islet transplantation in type 1 diabetes: an excellent graft function (β-score greater than 7) Is required to abrogate hyperglycemia, whereas a minimal function is necessary to suppress severe hypoglycemia (β-score greater than 3).J Clin Endocrinol Metab. 2012 Nov;97(11):E2078-83. doi: 10.1210/jc.2012-2115. Epub 2012 Sep 20. J Clin Endocrinol Metab. 2012. PMID: 22996144 Free PMC article. Clinical Trial.
-
25 YEARS OF THE RICORDI AUTOMATED METHOD FOR ISLET ISOLATION.CellR4 Repair Replace Regen Reprogram. 2013;1(1):e128. CellR4 Repair Replace Regen Reprogram. 2013. PMID: 30505878 Free PMC article.
-
Current Challenges in Pancreas and Islet Transplantation: A Scoping Review.Biomedicines. 2024 Dec 15;12(12):2853. doi: 10.3390/biomedicines12122853. Biomedicines. 2024. PMID: 39767759 Free PMC article.
-
Endocrine secretory reserve and proinsulin processing in recipients of islet of langerhans versus whole pancreas transplants.Diabetes Care. 2013 Nov;36(11):3726-31. doi: 10.2337/dc12-2710. Epub 2013 Sep 16. Diabetes Care. 2013. PMID: 24041681 Free PMC article.
References
-
- Kahn SE, Carr DB, Faulenbach MV, Utzschneider KM. An examination of beta-cell function measures and their potential use for estimating beta-cell mass. Diabetes Obes Metab. 2008;10(Suppl 4):63–76. - PubMed
-
- Robertson RP. Consequences on beta-cell function and reserve after long-term pancreas transplantation. Diabetes. 2004;53:633–644. - PubMed
-
- Rickels MR, Naji A, Teff KL. Acute insulin responses to glucose and arginine as predictors of beta-cell secretory capacity in human islet transplantation. Transplantation. 2007;84:1357–1360. - PubMed
-
- Luzi L. Metabolic strategies to predict and improve intrahepatic islet graft function. J Mol Med. 1999;77:49–56. - PubMed
Publication types
MeSH terms
Substances
Grants and funding
- M01 RR000040/RR/NCRR NIH HHS/United States
- U42 RR016603/RR/NCRR NIH HHS/United States
- M01 RR016587/RR/NCRR NIH HHS/United States
- U42RR0234001/RR/NCRR NIH HHS/United States
- R01 DK055347/DK/NIDDK NIH HHS/United States
- UL1RR024134/RR/NCRR NIH HHS/United States
- P30 DK019525/DK/NIDDK NIH HHS/United States
- T35 DK062709/DK/NIDDK NIH HHS/United States
- MO1RR16587/RR/NCRR NIH HHS/United States
- IU42 RR016603/RR/NCRR NIH HHS/United States
- U42 RR016600/RR/NCRR NIH HHS/United States
- 1R01-DK55347/DK/NIDDK NIH HHS/United States
- P30DK19525/DK/NIDDK NIH HHS/United States
- U42RR016600/RR/NCRR NIH HHS/United States
- UL1 RR024134/RR/NCRR NIH HHS/United States
LinkOut - more resources
Full Text Sources
Medical
