

Differences in gene expression and cytokine production by crystalline vs. amorphous silica in human lung epithelial cells
- PMID: 22300531
- PMCID: PMC3337246
- DOI: 10.1186/1743-8977-9-6
Differences in gene expression and cytokine production by crystalline vs. amorphous silica in human lung epithelial cells
Abstract
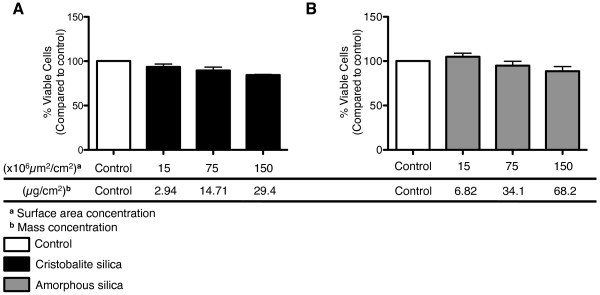
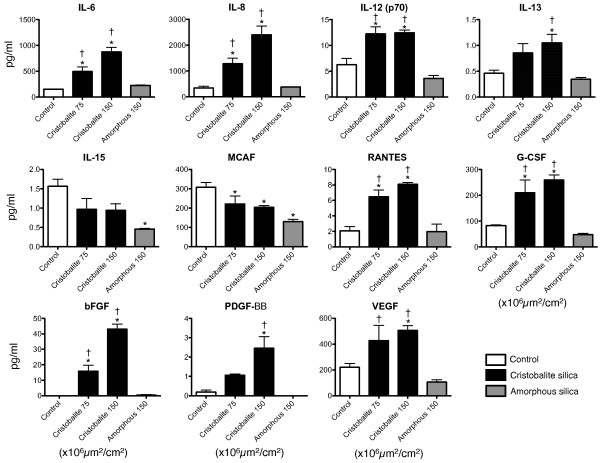
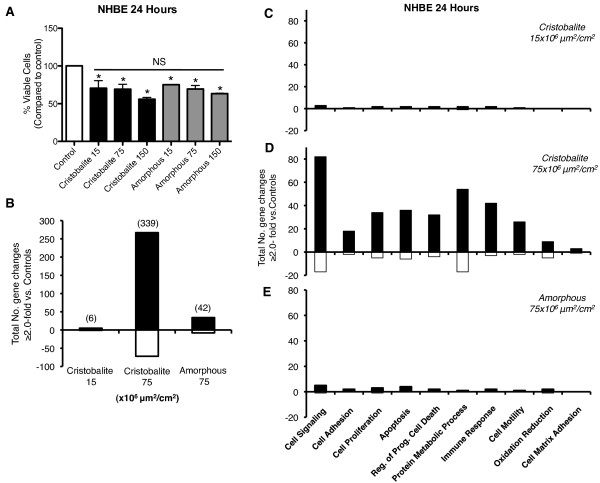
Background: Exposure to respirable crystalline silica particles, as opposed to amorphous silica, is associated with lung inflammation, pulmonary fibrosis (silicosis), and potentially with lung cancer. We used Affymetrix/GeneSifter microarray analysis to determine whether gene expression profiles differed in a human bronchial epithelial cell line (BEAS 2B) exposed to cristobalite vs. amorphous silica particles at non-toxic and equal surface areas (75 and 150 × 106μm2/cm2). Bio-Plex analysis was also used to determine profiles of secreted cytokines and chemokines in response to both particles. Finally, primary human bronchial epithelial cells (NHBE) were used to comparatively assess silica particle-induced alterations in gene expression.
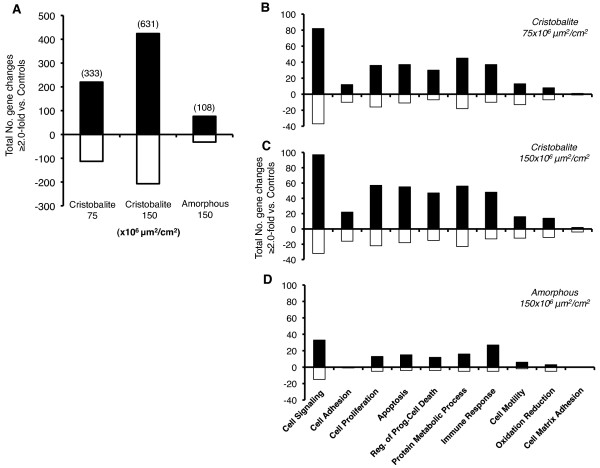
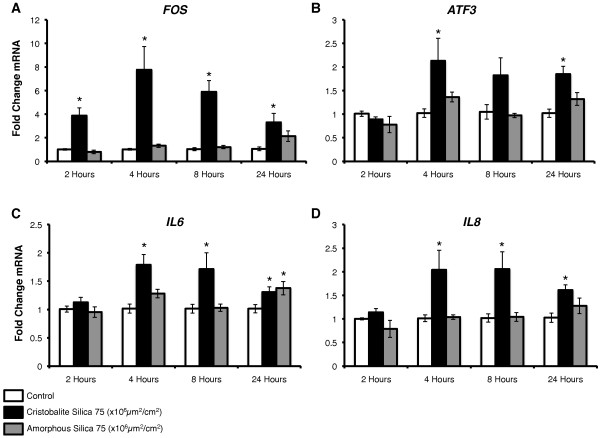
Results: Microarray analysis at 24 hours in BEAS 2B revealed 333 and 631 significant alterations in gene expression induced by cristobalite at low (75) and high (150 × 106μm2/cm2) amounts, respectively (p < 0.05/cut off ≥ 2.0-fold change). Exposure to amorphous silica micro-particles at high amounts (150 × 106μm2/cm2) induced 108 significant gene changes. Bio-Plex analysis of 27 human cytokines and chemokines revealed 9 secreted mediators (p < 0.05) induced by crystalline silica, but none were induced by amorphous silica. QRT-PCR revealed that cristobalite selectively up-regulated stress-related genes and cytokines (FOS, ATF3, IL6 and IL8) early and over time (2, 4, 8, and 24 h). Patterns of gene expression in NHBE cells were similar overall to BEAS 2B cells. At 75 × 106μm2/cm2, there were 339 significant alterations in gene expression induced by cristobalite and 42 by amorphous silica. Comparison of genes in response to cristobalite (75 × 106μm2/cm2) revealed 60 common, significant gene alterations in NHBE and BEAS 2B cells.
Conclusions: Cristobalite silica, as compared to synthetic amorphous silica particles at equal surface area concentrations, had comparable effects on the viability of human bronchial epithelial cells. However, effects on gene expression, as well as secretion of cytokines and chemokines, drastically differed, as the crystalline silica induced more intense responses. Our studies indicate that toxicological testing of particulates by surveying viability and/or metabolic activity is insufficient to predict their pathogenicity. Moreover, they show that acute responses of the lung epithelium, including up-regulation of genes linked to inflammation, oxidative stress, and proliferation, as well as secretion of inflammatory and proliferative mediators, can be indicative of pathologic potential using either immortalized lines (BEAS 2B) or primary cells (NHBE). Assessment of the degree and magnitude of these responses in vitro are suggested as predictive in determining the pathogenicity of potentially harmful particulates.
Figures
Similar articles
-
Indications for distinct pathogenic mechanisms of asbestos and silica through gene expression profiling of the response of lung epithelial cells.Hum Mol Genet. 2015 Mar 1;24(5):1374-89. doi: 10.1093/hmg/ddu551. Epub 2014 Oct 27. Hum Mol Genet. 2015. PMID: 25351596 Free PMC article.
-
Silica induces NLRP3 inflammasome activation in human lung epithelial cells.Part Fibre Toxicol. 2013 Feb 12;10:3. doi: 10.1186/1743-8977-10-3. Part Fibre Toxicol. 2013. PMID: 23402370 Free PMC article.
-
The Inflammatory Effect of Iron Oxide and Silica Particles on Lung Epithelial Cells.Lung. 2019 Apr;197(2):199-207. doi: 10.1007/s00408-019-00200-z. Epub 2019 Feb 14. Lung. 2019. PMID: 30767051
-
Inhaled amorphous silica particulates: what do we know about their toxicological profiles?J Environ Pathol Toxicol Oncol. 2001;20 Suppl 1:133-41. J Environ Pathol Toxicol Oncol. 2001. PMID: 11570670 Review.
-
Signaling pathways controlling the production of inflammatory mediators in response to crystalline silica exposure: role of reactive oxygen/nitrogen species.Free Radic Biol Med. 2004 Oct 1;37(7):916-25. doi: 10.1016/j.freeradbiomed.2004.05.032. Free Radic Biol Med. 2004. PMID: 15336307 Review.
Cited by
-
Characterization of Nanoparticle Batch-To-Batch Variability.Nanomaterials (Basel). 2018 May 8;8(5):311. doi: 10.3390/nano8050311. Nanomaterials (Basel). 2018. PMID: 29738461 Free PMC article.
-
[In vitro toxicity of naturally occurring silica nanoparticles in C1 coal in bronchial epithelial cells].Zhongguo Fei Ai Za Zhi. 2012 Oct;15(10):561-8. doi: 10.3779/j.issn.1009-3419.2012.10.01. Zhongguo Fei Ai Za Zhi. 2012. PMID: 23075679 Free PMC article. Chinese.
-
Quantitative Profiling of Protein S-Glutathionylation Reveals Redox-Dependent Regulation of Macrophage Function during Nanoparticle-Induced Oxidative Stress.ACS Nano. 2016 Jan 26;10(1):524-38. doi: 10.1021/acsnano.5b05524. Epub 2015 Dec 29. ACS Nano. 2016. PMID: 26700264 Free PMC article.
-
Dysregulation of macrophage activation profiles by engineered nanoparticles.ACS Nano. 2013 Aug 27;7(8):6997-7010. doi: 10.1021/nn402145t. Epub 2013 Jul 9. ACS Nano. 2013. PMID: 23808590 Free PMC article.
-
Cell Type- and Exposure-Specific Modulation of CD63/CD81-Positive and Tissue Factor-Positive Extracellular Vesicle Release in response to Respiratory Toxicants.Oxid Med Cell Longev. 2019 Aug 14;2019:5204218. doi: 10.1155/2019/5204218. eCollection 2019. Oxid Med Cell Longev. 2019. PMID: 31485294 Free PMC article.
References
-
- Mundt KA, Birk T, Parsons W, Borsch-Galetke E, Siegmund K, Heavner K, Guldner K. Respirable crystalline silica exposure-response evaluation of silicosis morbidity and lung cancer mortality in the German porcelain industry cohort. J Occup Environ Med. 2011;53:282–289. doi: 10.1097/JOM.0b013e31820c2bff. - DOI - PubMed
-
- Cox LA. , JrAn Exposure-Response Threshold for Lung Diseases and Lung Cancer Caused by Crystalline Silica. Risk Anal. 2011. - PubMed
Publication types
MeSH terms
Substances
Grants and funding
LinkOut - more resources
Full Text Sources
Miscellaneous
