

Patient, center and geographic characteristics of nationally placed livers
- PMID: 22300591
- PMCID: PMC3689311
- DOI: 10.1111/j.1600-6143.2011.03962.x
Patient, center and geographic characteristics of nationally placed livers
Abstract
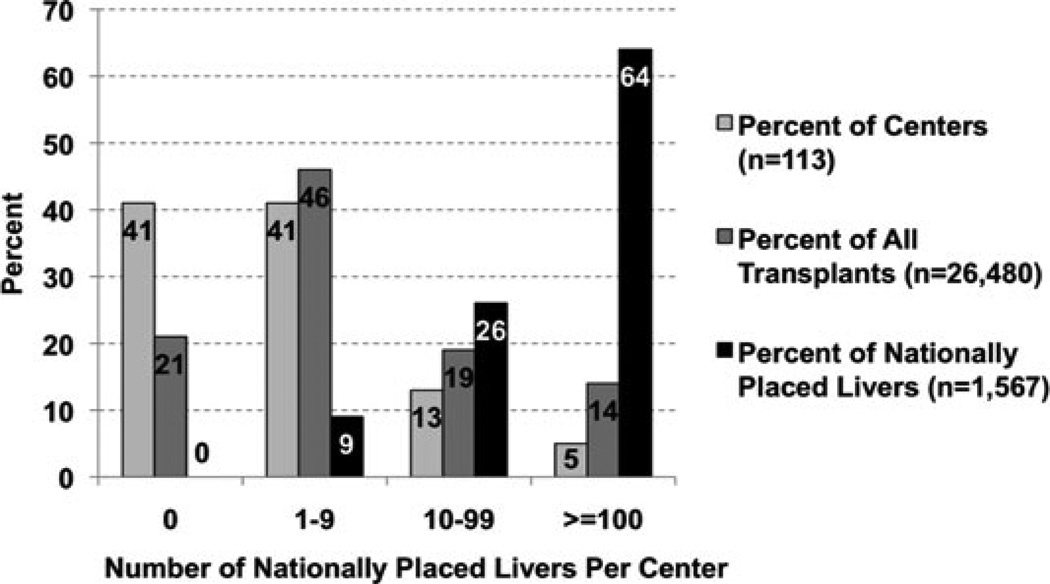
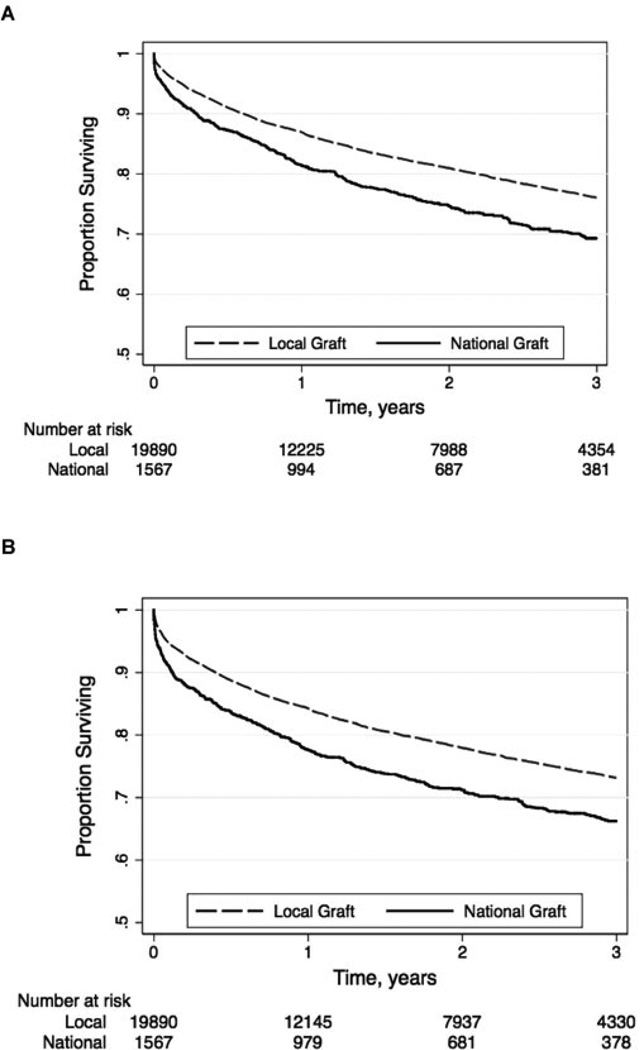
Once a liver offer has been refused locally and regionally, it is offered nationally. We characterized nationally (n = 1567) versus locally (n = 19 893) placed grafts from adult, nonfulminant, deceased donor liver transplants (LT) from 2/1/05 to 1/31/10. Donors of nationally versus locally placed livers differed by age (50 vs. 42 years), positive HCV antibody (11 vs. 2%) and death from stroke (51 vs. 42%) (p < 0.001 for all). Recipients of nationally versus locally placed livers differed by LT-MELD (20 vs. 24), rates of ascites (35 vs. 37%), encephalopathy (12 vs. 15%), hepatocellular (17 vs. 24%) and nonhepatocellular exceptions (6 vs. 11%) (p ≤ 0.03 for all). Six (5%) centers utilized 64% of the nationally placed grafts while 43 (38%) centers accepted zero during the 5-year period; all high volume centers used ≥1. Compared to local distribution, transplantation with a nationally placed liver was associated with a similar adjusted risk of graft (HR, 0.99; 95% CI, 0.86-1.14) and patient (HR, 0.98; 95% CI, 0.84-1.14; p = 0.77) survival. In conclusion, utilization of nationally placed livers is highly concentrated in very few centers, with no increased adjusted risk of graft loss. These findings provide the foundation for a more informed discussion about changing our current liver allocation and distribution policies.
© Copyright 2012 The American Society of Transplantation and the American Society of Transplant Surgeons.
Conflict of interest statement
The authors of this manuscript have no conflicts of interest to disclose as described by the
Figures
Comment in
-
Truth and consequences: the challenge of greater transparency in liver distribution and utilization.Am J Transplant. 2012 Apr;12(4):808-9. doi: 10.1111/j.1600-6143.2011.03960.x. Am J Transplant. 2012. PMID: 22458382 No abstract available.
-
Transplantation: Sharing of donated livers is not equal.Nat Rev Gastroenterol Hepatol. 2012 Apr 17;9(5):248-9. doi: 10.1038/nrgastro.2012.69. Nat Rev Gastroenterol Hepatol. 2012. PMID: 22508162 No abstract available.
-
Nationally placed liver allografts: the devil is in the details.Am J Transplant. 2012 Oct;12(10):2861-2; author reply 2863. doi: 10.1111/j.1600-6143.2012.04230.x. Epub 2012 Sep 4. Am J Transplant. 2012. PMID: 22947411 No abstract available.
References
-
- Feng S, Goodrich NP, Bragg-Gresham JL, et al. Characteristics associated with liver graft failure: The concept of a donor risk index. Am J Transplant. 2006;6:783–790. - PubMed
-
- Organ Procurement and Transplantation Network. Policy 3.6: Allocation of Livers. [Accessed July 8, 2011]; Available at: http://optntransplanthrsagov/PoliciesandBylaws2/policies/pdfs/policy_8pdf.
-
- Kamath PS, Wiesner RH, Malinchoc M, et al. A model to predict survival in patients with end-stage liver disease. Hepatology. 2001;33:464–470. - PubMed
-
- Williams RL. A note on robust variance estimation for cluster-correlated data. Biometrics. 2000;56:645–646. - PubMed
-
- Ozhathil DK, Li YF, Smith JK, et al. Impact of center volume on outcomes of increased-risk liver transplants. Liver Transplant. 2011;17:1191–1199. - PubMed
Publication types
MeSH terms
Grants and funding
LinkOut - more resources
Full Text Sources
Medical
