. 2012 Apr;22(4):623-32.
doi: 10.1101/gr.125187.111. Epub 2012 Feb 1.

Age-associated DNA methylation in pediatric populations

Affiliations

Age-associated DNA methylation in pediatric populations

Reid S Alisch et al. Genome Res. 2012 Apr.

Abstract

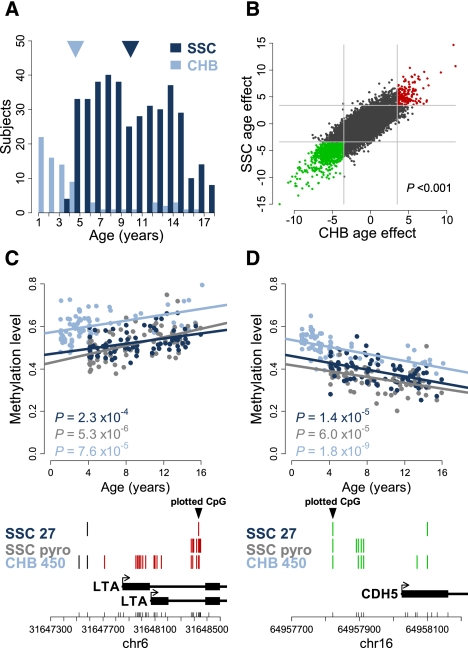
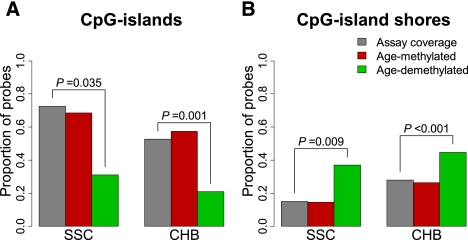
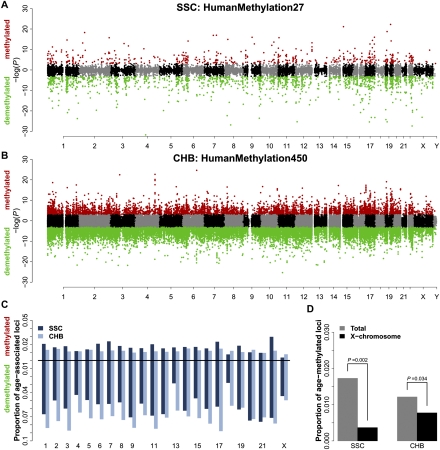
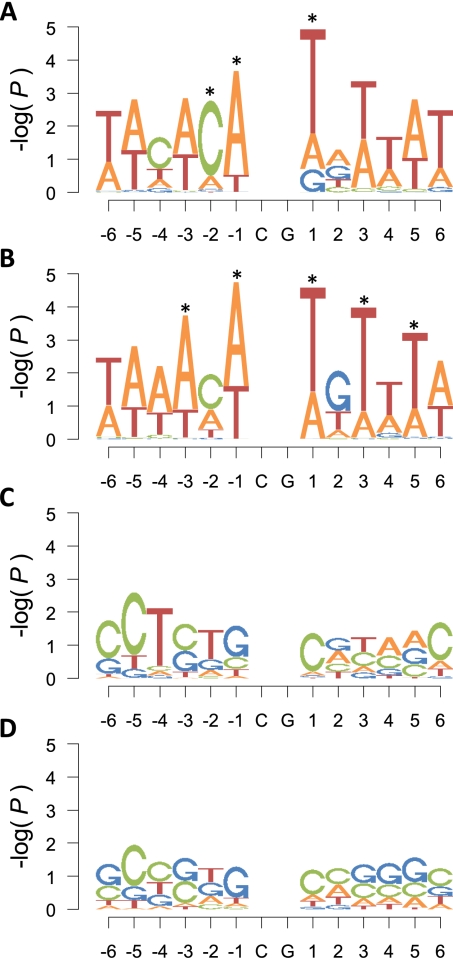
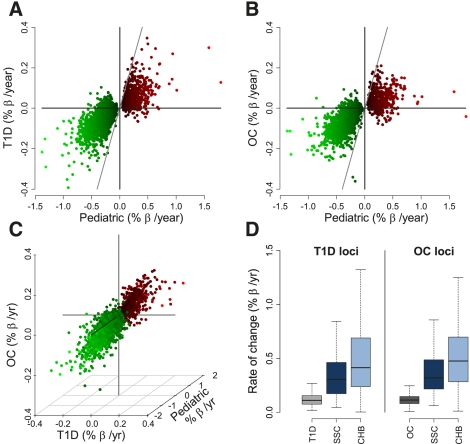
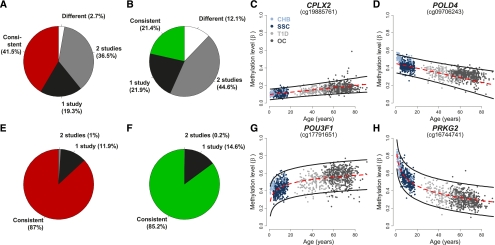
DNA methylation (DNAm) plays diverse roles in human biology, but this dynamic epigenetic mark remains far from fully characterized. Although earlier studies uncovered loci that undergo age-associated DNAm changes in adults, little is known about such changes during childhood. Despite profound DNAm plasticity during embryogenesis, monozygotic twins show indistinguishable childhood methylation, suggesting that DNAm is highly coordinated throughout early development. Here we examine the methylation of 27,578 CpG dinucleotides in peripheral blood DNA from a cross-sectional study of 398 boys, aged 3-17 yr, and find significant age-associated changes in DNAm at 2078 loci. These findings correspond well with pyrosequencing data and replicate in a second pediatric population (N = 78). Moreover, we report a deficit of age-related loci on the X chromosome, a preference for specific nucleotides immediately surrounding the interrogated CpG dinucleotide, and a primary association with developmental and immune ontological functions. Meta-analysis (N = 1158) with two adult populations reveals that despite a significant overlap of age-associated loci, most methylation changes do not follow a lifelong linear pattern due to a threefold to fourfold higher rate of change in children compared with adults; consequently, the vast majority of changes are more accurately modeled as a function of logarithmic age. We therefore conclude that age-related DNAm changes in peripheral blood occur more rapidly during childhood and are imperfectly accounted for by statistical corrections that are linear in age, further suggesting that future DNAm studies should be matched closely for age.


Figures

Figure 1.
Figure 1.
Pediatric age-associated DNA methylation. (A) Age distribution of the 398 Simons Simplex Collection (SCC: dark blue) and 78 Children's Hospital Boston (CHB: light blue) pediatric subjects, with mean ages denoted by arrowheads (dark blue and light blue, respectively). (B) Scatterplot of the age effect as measured by the age-associated t-statistic for the SSC (y-axis) and CHB (x-axis) populations. Each point represents one CpG locus interrogated by both assays and those loci found to be significant (FDR < 0.01) in both populations are red (age-methylated) or green (age-demethylated). (Light gray lines) The significance thresholds in each population; the P-value is the significance of the correlation, as determined by permutation testing. (C,D) Validation of representative age-associated loci in the SSC population, with the CHB data overlaid for comparison. Infinium HumanMethylation27 (SSC Inf27: dark blue) and pyrosequencing (SSC pyro: gray) data are shown for the subset of 75 individuals from the SSC population. In addition, the same loci are shown for the entire CHB population (N = 78), run on the HumanMethylation450 (Inf450: light blue). Lines represent the linear regression of each set of data independently; the P-values are the age-effect significance in the population shown. The y-axis is the methylation level measured by all three assays. Below each plot is a schematic of the interrogated locus and annotated genes in the region. (Black triangle) The CpG locus shown in the above plot; CpG coverage of each assay is denoted by vertical lines, with red denoting a significant (FDR<0.01) age-methylating effect, and green a significant age-demethylating effect; those in black are not significantly associated with age. The chromosome (chr), total CpGs in the region (small vertical black lines), and relative genomic coordinates (NCBI build 36.1) are denoted on the x-axis below the gene schematic.
Figure 2.
Figure 2.
Proportion of age-associated loci in CpG islands and “shores” in the SSC and CHB cohorts. Barplots of the proportion of age-methylated (red) and age-demethylated (green) loci relative to total assay coverage (gray) found in CpG islands (A) and CpG island “shores” (B). Significant permutation P-values are displayed.
Figure 3.
Figure 3.
Pediatric age-associated loci by chromosome. (A,B) Modified Manhattan plots of age-associated loci in the SSC (A) and CHB (B) populations: loci positively correlated with age are displayed with a positive −log(P-value), and loci negatively correlated with age are displayed with a negative −log(P-value). Loci significantly age-methylated (red) or age-demethylated (green) (FDR < 0.01); otherwise loci are black or gray on alternating chromosomes. (C) Proportion of age-associated loci by chromosome in the SSC (dark blue) and CHB (light blue) populations: the proportion of age-methylated loci is displayed on the positive y-axis and age-demethylated loci on the negative y-axis. The Y chromosome is not shown because only seven probes are available in the SSC data. (D) Proportion of X-chromosome probes (black) that undergo age-methylation events compared with the proportion of all probes (gray) on the available assays for the SSC (left) and CHB (right) data sets. P-values are calculated by permutation testing.
Figure 4.
Figure 4.
Nucleotide composition surrounding age-associated loci. Logo plots of nucleotide composition immediately adjacent to age-demethylated (A,B) and age-methylated (C,D) CpG loci in the SSC (A,C) and CHB (B,D) populations. The height of each letter represents the significance [−log(P-value)] of overrepresentation for each base at the given location. Significance is determined by permutation testing relative to the assay composition.
Figure 5.
Figure 5.
DNA methylation changes in pediatric and adult populations. Scatterplot showing the rates of DNAm change in the SSC pediatric population (x-axis) as compared with the adult T1D (A) and OC (B) populations. Each point represents one of the 2078 CpG loci found significant in the SSC pediatric cohort; points are colored by the rate of DNAm change in the SSC population (larger-to-smaller shown in light to dark colors; green: age-demethylated, red: age-methylated). The diagonal line represents the one-to-one line. (C) Three-dimensional scatterplot showing correlation of the average age-associated rate of DNA methylation in the SSC (z-axis), T1D (x-axis), and OC (y-axis) populations. Units and colors are as in A and B. (D) Boxplot of rates of DNA methylation change for the 363 loci found in common between the SSC and T1D studies (left) and the 325 loci found in common between the SSC and OC studies. The rates of DNAm change for these loci are also shown for the CHB population.
Figure 6.
Figure 6.
Meta-analysis of pediatric and adult populations: modeling rates of DNAm change via an interaction model. (A,B) Pie charts displaying the proportion of SSC age-methylated (A) and age-demethylated (B) loci that have significantly different rates of DNAm change from the rates found in the CHB, T1D, and OC populations (different: white); in two of these studies (gray); and in one of these studies (black). Loci with similar rates of DNAm change across all four populations are shown in red (A: age-methylated), and green (B: age-demethylated). (C,D) Representative age-methylated (C) and age-demethylated (D) loci that have a similar rate of DNAm change in all populations. (Red dashed line) The linear regression on the SSC data only; (black lines) the 95% predication interval based on this regression. All individuals are denoted by dots and their colors are described in the inset of C. Each plot is titled by the name of the gene associated with the CpG interrogated by the Illumina platform. (E,F) Pie charts similar to those in A and B but modeling the log of age. (G,H) Representative age-methylated (G) and age-demethylated (H) loci that follow a log of age (but not linear) trend in all populations.

References

    1. Ahuja N, Issa JP 2000. Aging, methylation and cancer. Histol Histopathol 15: 835–842 - PubMed
    1. Ahuja N, Li Q, Mohan AL, Baylin SB, Issa JP 1998. Aging and DNA methylation in colorectal mucosa and cancer. Cancer Res 58: 5489–5494 - PubMed
    1. Arima T, Drewell RA, Arney KL, Inoue J, Makita Y, Hata A, Oshimura M, Wake N, Surani MA 2001. A conserved imprinting control region at the HYMAI/ZAC domain is implicated in transient neonatal diabetes mellitus. Hum Mol Genet 10: 1475–1483 - PubMed
    1. Bjornsson HT, Sigurdsson MI, Fallin MD, Irizarry RA, Aspelund T, Cui H, Yu W, Rongione MA, Ekstrom TJ, Harris TB, et al. 2008. Intra-individual change over time in DNA methylation with familial clustering. JAMA 299: 2877–2883 - PMC - PubMed
    1. Bocker MT, Hellwig I, Breiling A, Eckstein V, Ho AD, Lyko F 2011. Genome-wide promoter DNA methylation dynamics of human hematopoietic progenitor cells during differentiation and aging. Blood 117: e182–e189 - PubMed

Publication types

Associated data