Review
. 2012 Feb 7;59(6):553-65.
doi: 10.1016/j.jacc.2011.08.079.

Effects of radiation exposure from cardiac imaging: how good are the data?

Affiliations
Review

Effects of radiation exposure from cardiac imaging: how good are the data?

Andrew J Einstein. J Am Coll Cardiol. .

Abstract

Concerns about medical exposure to ionizing radiation have become heightened in recent years as a result of rapid growth in procedure volumes and the high radiation doses incurred from some procedures. This paper summarizes the evidence base undergirding concerns about radiation exposure in cardiac imaging. After classifying radiation effects, explaining terminology used to quantify the radiation received by patients, and describing typical doses from cardiac imaging procedures, this paper will address the major epidemiological studies having bearing on radiation effects at doses comparable to those received by patients undergoing cardiac imaging. These include studies of atomic bomb survivors, nuclear industry workers, and children exposed in utero to x-rays, all of which have evidenced increased cancer risks at low doses. Additional higher-dose epidemiological studies of cohorts exposed to radiation in the context of medical treatment are described and found to be generally compatible with these cardiac dose-level studies, albeit with exceptions. Using risk projection models developed by the U.S. National Academies that incorporate these data and reflect several evidence-based assumptions, cancer risk from cardiac imaging can be estimated and compared with the benefits from imaging. Several ongoing epidemiological studies will provide better understanding of radiation-associated cancer risks.


Figures

Figure 1
Figure 1. Growth in nuclear SPECT myocardial perfusion imaging volume
Data sources: Arlington Medical Resources (AMR), courtesy Greg Thomas, MD, and IMV.(3)
Figure 2
Figure 2. The Increasing US Radiation Burden. Data from National Council on Radiation Protection and Measurements Reports 93(4) and 160(5), from all sources except radiation therapy
Note that collective dose from cardiovascular imaging and intervention in 2006 constituted 19% of the collective effective dose of radiation from all non-radiotherapy sources to the US population, and was nearly 3 times the collective dose from all sources in the early 1980s.
Figure 3
Figure 3. Typical effective doses from cadiac imaging procedures
PT denotes Prospective Triggering. Adapted from Einstein.(12)
Figure 4
Figure 4. Coronary CT angiogram performed in a 64 year old obese man with atypical chest pain and frequent ventricular ectopy
The scanner used is most commonly operated using a tube voltage of 100 kVp and single-heartbeat volume scanning with x-rays delivered only during a ~400 msec window during diastole, resulting in a Dose-Length Product (DLP) for angiography of ~60–150 mGy·cm. Here, because of the patient’s habitus and ectopy, the scanner was operated at 120 kVp and a scan mode which leaves the x-ray tube on throughout the cardiac cycle and continues image acquisition in subsequent beats if ectopy is detected. The study was diagnostic and excluded coronary artery disease (bottom left), despite 3 out of 4 heartbeats being premature ventricular contractions (top left), however the x-ray tube remained on for over 3 seconds and the total DLP was ~2500 mGy·cm (top right). In a population of patients undergoing similar scans, this would correspond to an estimated effective dose of ~78 mSv using an updated conversion factor.(15)
Figure 5
Figure 5. Sample size of a cohort exposed to different radiation doses, that would be required to detect a significant increase in cancer mortality in that cohort, assuming lifetime follow-up
From Brenner et al 2003(18), based on National Research Council 1995(17).
Figure 6
Figure 6. Simplified Hiroshima atomic bomb dosimetry
Map of Hiroshima is overlayed with colors reflecting typical patient doses at distance from hypocenter. Red circle constitutes area in which typical colon dose was at least 100 mGy (effective dose at least 100 mSv) and orange ring constitutes area with typical effective dose of 5–100 mSv; together these roughly correspond to “Exposed” cohort. Green area constitutes area with typical effective dose of <5 mSv, roughly corresponding to “Nonexposed” cohort. Significantly more cancers have been observed in the orange ring than would be expected based on rates in the green region, an excess that is attributed to ionizing radiation. The actual current dosimetry system, updated in 2002, reflects several factors in addition to distance from hypocenter, including shielding history and information on acute effects such as burns and epilation. Hiroshima map without overlays from http://www.atomicarchive.com/Maps/HiroshimaMap.shtml.
Figure 7
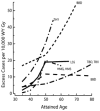
Figure 7. Excess breast cancer rate per woman-year Gy using excess absolute risk models: comparison of Life Span Study (LSS) of Japanese atomic bomb survivors to medically-exposed cohorts
THY denotes thymic enlargement cohort(45), BBD benign breast disease(44), HMG, HMS hemangioma in Gothenberg(38) and Stockholm(42), TBO, TBX original (41) and extended (40) Massachusetts tuberculosis cohorts. From Preston et al 2002.(46)
Figure 8
Figure 8. Estimated risk of cancer incidence attributable to coronary CT angiogram
Top, estimates from Einstein et al.(64) Bottom, estimates from Huang et al(65), which are comparable to those of Einstein and demonstrate markedly lower risk with prospectively gated protocol.
Figure 9
Figure 9. Reduction of cancer risk from coronary CT angiography in post-coronary artery bypass graft patients in comparison to healthy patients
Error bars show 95% confidence intervals on the estimated risk ratio. From Brenner et al.(68)

References

    1. Fryback DG, Thornbury JR. The efficacy of diagnostic imaging. Med Decis Making. 1991;11:88–94. - PubMed
    1. Abraham A, Nichol G, Williams KA, et al. 18F-FDG PET imaging of myocardial viability in an experienced center with access to 18F-FDG and integration with clinical management teams: the Ottawa-FIVE substudy of the PARR 2 trial. J Nucl Med. 2010;51:567–74. - PubMed
    1. 2005 Nuclear Medicine Census Market Summary Report. Des Plaines, IL: IMV Medical Information Division; 2006.
    1. National Council on Radiation Protection and Measurements. Report No. 93, Ionizing Radiation Exposure of the Population of the United States. Bethesda, MD: 1987.
    1. National Council on Radiation Protection and Measurements. Report No. 160, Ionizing Radiation Exposure of the Population of the United States. Bethesda, MD: 2009.

Publication types