. 2012 May;22(5):860-9.
doi: 10.1101/gr.131201.111. Epub 2012 Feb 2.

Effects of sequence variation on differential allelic transcription factor occupancy and gene expression

Affiliations

Effects of sequence variation on differential allelic transcription factor occupancy and gene expression

Timothy E Reddy et al. Genome Res. 2012 May.

Abstract

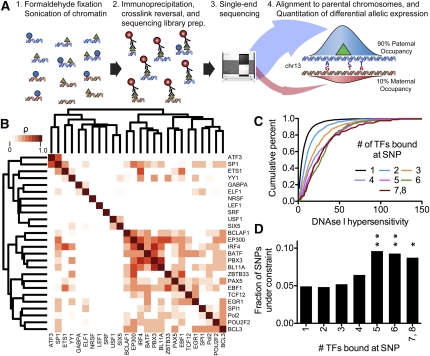
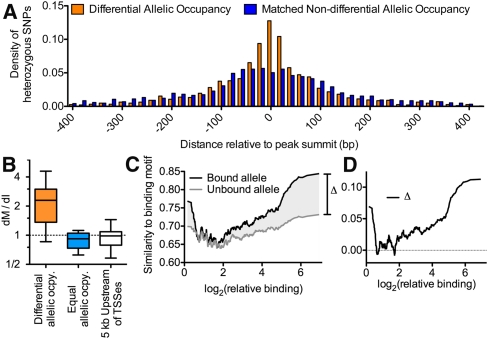
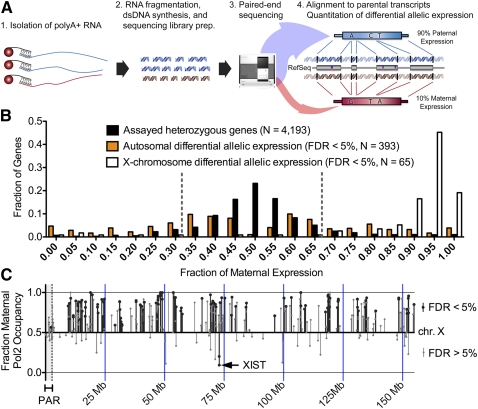
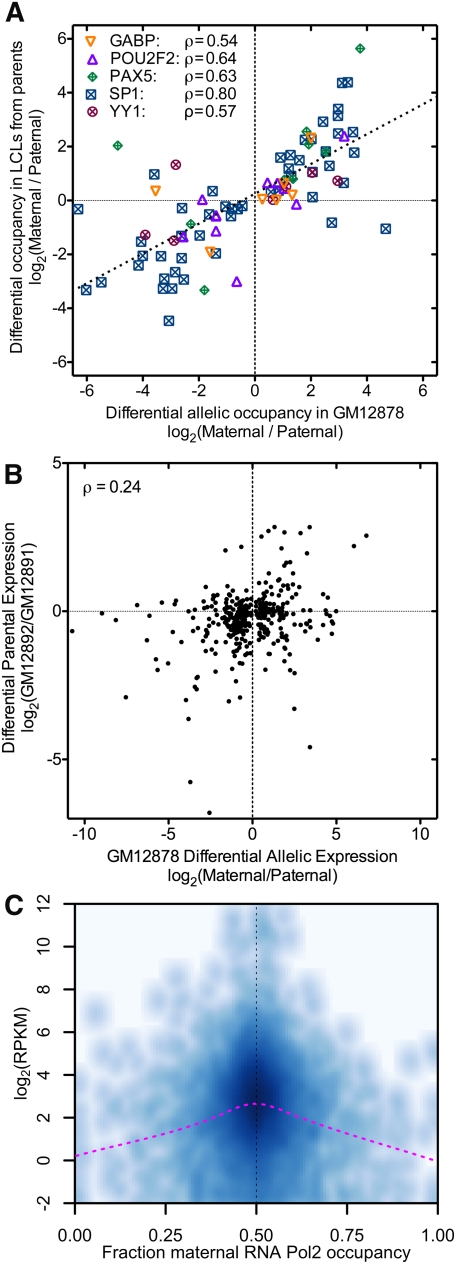
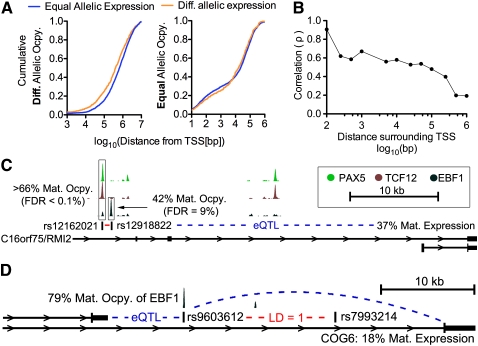
A complex interplay between transcription factors (TFs) and the genome regulates transcription. However, connecting variation in genome sequence with variation in TF binding and gene expression is challenging due to environmental differences between individuals and cell types. To address this problem, we measured genome-wide differential allelic occupancy of 24 TFs and EP300 in a human lymphoblastoid cell line GM12878. Overall, 5% of human TF binding sites have an allelic imbalance in occupancy. At many sites, TFs clustered in TF-binding hubs on the same homolog in especially open chromatin. While genetic variation in core TF binding motifs generally resulted in large allelic differences in TF occupancy, most allelic differences in occupancy were subtle and associated with disruption of weak or noncanonical motifs. We also measured genome-wide differential allelic expression of genes with and without heterozygous exonic variants in the same cells. We found that genes with differential allelic expression were overall less expressed both in GM12878 cells and in unrelated human cell lines. Comparing TF occupancy with expression, we found strong association between allelic occupancy and expression within 100 bp of transcription start sites (TSSs), and weak association up to 100 kb from TSSs. Sites of differential allelic occupancy were significantly enriched for variants associated with disease, particularly autoimmune disease, suggesting that allelic differences in TF occupancy give functional insights into intergenic variants associated with disease. Our results have the potential to increase the power and interpretability of association studies by targeting functional intergenic variants in addition to protein coding sequences.


Figures

Figure 1.
Figure 1.
(A) Diagram of method used to measure differential allelic TF occupancy. First, chromatin was formaldehyde-fixed and sonicated. Cross-linked TF-binding complexes were then immunoprecipitated with an antibody specific for the TF of interest. The co-precipitated DNA was recovered and subjected to high-throughput single-end sequencing. Reads were aligned to maternal and paternal versions of the GM12878 genome according to data from the 1000 Genomes Project (The 1000 Genomes Project Consortium 2010). For each binding site, differential allelic occupancy was called when reads aligned to a single allele significantly more often than would be expected by random. (B) Spearman correlation of allelic imbalance at sites of TF co-occupancy throughout the genome. The color of the boxes indicates the correlation coefficient, with white indicating nonsignificant correlation (P > 0.05). The tree shows complete linkage hierarchical clustering. (C) We classified heterozygous variants by the number of TFs binding at that variant. Shown is the cumulative distribution of DNase I hypersensitivity signal at all occupied heterozygous variants in each class, as indicated in the legend. (D) For each class of heterozygous variants (as defined in C), the fractions of variants with phastCons score >0.5. Asterisks ([**] P < 0.01; [*] P < 0.05) indicate statistical significance compared to the uniquely bound variants as described in Methods.
Figure 2.
Figure 2.
(A) Histogram of the distance of heterozygous SNPs from the location of maximal ChIP-seq signal for sites with (orange) and without (blue) differential allelic TF occupancy. To control for potential observation biases resulting from high read coverage at variants near the center of binding sites, the sites of equal allelic occupancy were chosen to match the differential allelic occupancy in two ways. First, for each site of differential allelic occupancy, we required the total number of aligned reads covering heterozygous variants in the matched site to be equivalent. Second, we required that the total number of variants in each binding site was also equivalent. If a suitably matched site did not exist, the site was excluded from the sites of differential allelic occupancy for this analysis. Using this strategy, the distribution of aligned reads at heterozygous variants was not significantly different between the sites of differential allelic occupancy and the matched set of equal allelic occupancy (P = 0.15, two-sided Wilcoxon rank-sum test). (B) The ratio of the rate of motif-disrupting to non-motif-disrupting intergenic mutations (dM/dI) across all sited of differential allelic TF occupancy (orange), and at TF binding sites that lack significant differential allelic occupancy (blue). To allow comparison with cis-regulatory DNA, the distribution of dM/dI is also shown for regions 5 kbp upstream of 10,000 randomly chosen TSSs (white). Whiskers show 95% confidence intervals. We excluded TFs for which we only observed a single motif-disrupting variant across all binding sites. (C) For the bound (black) or unbound (gray) allele at all sites of differential allelic occupancy, the similarity to TF binding motif (as a fraction of the optimal match) at sites of heterozygosity (y-axis) plotted against relative binding (the ratio of reads aligning to the bound vs. unbound allele; x-axis). Data were smoothed over a 32-data-point sliding window. The shaded region labeled Δ indicates the amount of difference in motif similarity between bound and unbound alleles, and is plotted in panel D.
Figure 3.
Figure 3.
(A) Diagram of our method for using RNA-seq to measure differential allelic expression. First, poly(A)+ RNA was isolated using magnetic beads conjugated to oligo(dT) nucleotides. After RNA fragmentation, dsDNA was synthesized and subjected to paired-end sequencing on an Illumina Genome Analyzer. Reads were then aligned to GM12878-specific maternal and paternal versions of all RefSeq transcripts. Differential allelic expression was called when significantly more reads aligned to a single allele than would be expected by random. (B) Distribution of the fraction of maternal expression for all heterozygous genes (black), autosomal genes with differential allelic expression (orange), and X-chromosomal genes with differential allelic expression (white). (C) Prediction of differential allelic expression (y-axis) along the X chromosome (x-axis) using allelic occupancy of RNA Pol2. (Black lines) Significant differential allelic RNA Pol2 occupancy; (gray lines) nonsignificant binding. The shaded region on the left indicates the pseudoautosomal region that is not inactivated. All significant differential allelic occupancy predicted expression as expected. Genes that do not achieve statistical significance in the inactivated region of the X were a mix of genes that are known to escape inactivation as well as false negatives.
Figure 4.
Figure 4.
(A) Inheritance of allelic TF occupancy. The log-ratio of occupancy of the indicated TFs in the maternally versus paternally derived LCLs (y-axis) is plotted against the allelic occupancy of the same factors in GM12878 (x-axis). For each site plotted (N = 85), we required that both parents were homozygous for alternate alleles. Combining all points together, the overall correlation is ρ = 0.75, and for 88% of sites, the more bound allele in GM12878 was also more bound in the corresponding parent. (B) Similar to A, the log-ratio of expression from the parental LCLs plotted as a function of the allelic expression in GM12878. (C) Genes with differential allelic expression have overall lower expression in GM12878. For each gene with expression >0.25 RPKM, the gene expression (y-axis) is shown as a function of differential allelic RNA Pol2 occupancy (x-axis). (Darker shading) Greater density of values; (magenta line) less smoothing over the data.
Figure 5.
Figure 5.
(A) Cumulative distribution of the distance from the TSS (x-axis) to the nearest site of differential allelic occupancy for all autosomal genes with differential allelic (orange) or equal allelic (blue) expression. (Left) All genes with differential allelic expression, where the difference between the two distributions is highly significant. (Right) Genes with equal allelic expression, and there is no significant difference between the two distributions. (B) Spearman's correlation (y-axis) of allelic occupancy with allelic expression within the distance from autosomal TSSs indicated on the x-axis. For each point, we aggregated all allelic occupancy (both for sites with and without a significant allelic imbalance) at the indicated distance around all genes with significant differential allelic expression. Then, for every gene with at least a single site with a significant differential allelic occupancy, we calculate Spearman's correlation coefficient and plot. Detailed scatter plots are included in Supplemental Figure 20. (C) Differential allelic occupancy of multiple factors at variants either directly or through perfect linkage disequilibrium (R2 = 1; red dash) with celiac disease. Nearby, RMI2 (also known as C16orf75) is predominantly expressed from the maternal allele, and the regulatory interaction is supported by expression quantitative trait loci (eQTL) mapping. (D) Similar to C, allelic occupancy of EBF1 at a variant associated (via linkage disequilibrium) with psoriasis corresponds with differential allelic expression of COG6. Again, the regulatory interaction is supported by eQTL analysis.

Comment in

References

    1. The 1000 Genomes Project Consortium 2010. A map of human genome variation from population-scale sequencing. Nature 467: 1061–1073 - PMC - PubMed
    1. Benjamini Y, Hochberg Y 1995. Controlling the false discovery rate: a practical and powerful approach to multiple testing. J R Stat Soc Ser B Methodol 57: 289–300
    1. Brown CJ, Ballabio A, Rupert JL, Lafreniere RG, Grompe M, Tonlorenzi R, Willard HF 1991. A gene from the region of the human X inactivation centre is expressed exclusively from the inactive X chromosome. Nature 349: 38–44 - PubMed
    1. Carrel L, Willard HF 2005. X-inactivation profile reveals extensive variability in X-linked gene expression in females. Nature 434: 400–404 - PubMed
    1. Cheng Y, Wu W, Kumar SA, Yu D, Deng W, Tripic T, King DC, Chen KB, Zhang Y, Drautz D, et al. 2009. Erythroid GATA1 function revealed by genome-wide analysis of transcription factor occupancy, histone modifications, and mRNA expression. Genome Res 19: 2172–2184 - PMC - PubMed

Publication types

MeSH terms

LinkOut - more resources