. 2012 Apr;63(7):2541-56.
doi: 10.1093/jxb/err431. Epub 2012 Feb 2.

A R2R3-type MYB gene, OsMYB2, is involved in salt, cold, and dehydration tolerance in rice

Affiliations

A R2R3-type MYB gene, OsMYB2, is involved in salt, cold, and dehydration tolerance in rice

An Yang et al. J Exp Bot. 2012 Apr.

Abstract

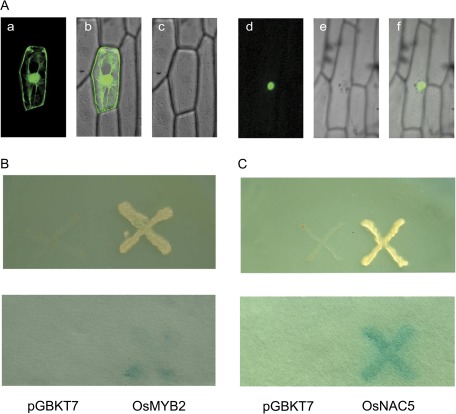
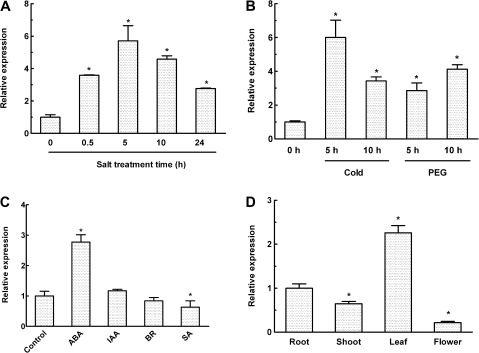
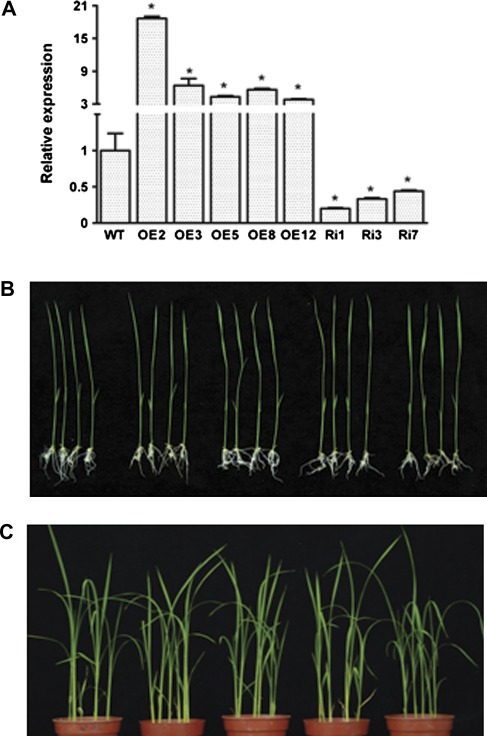
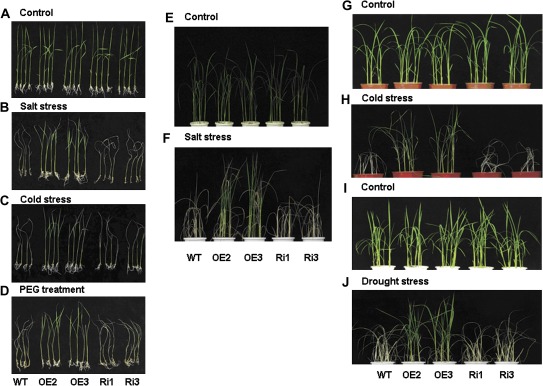
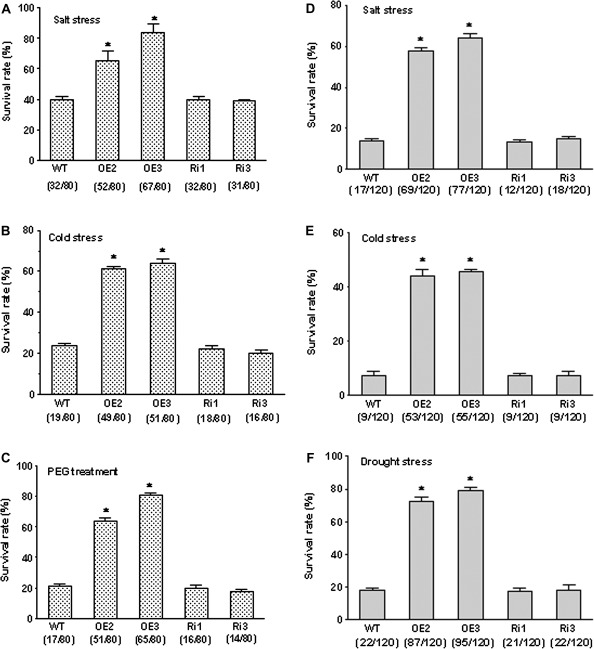
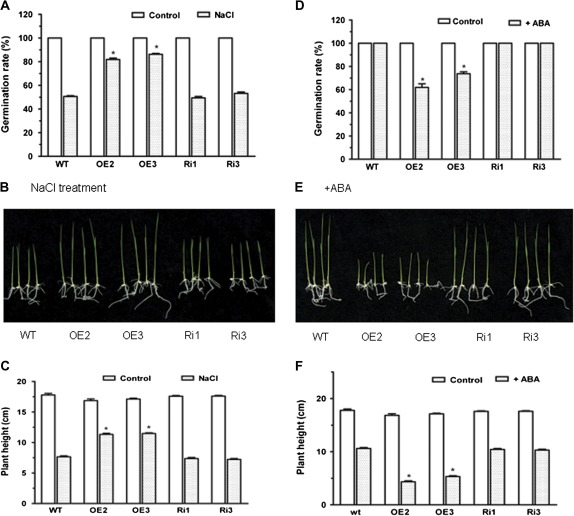
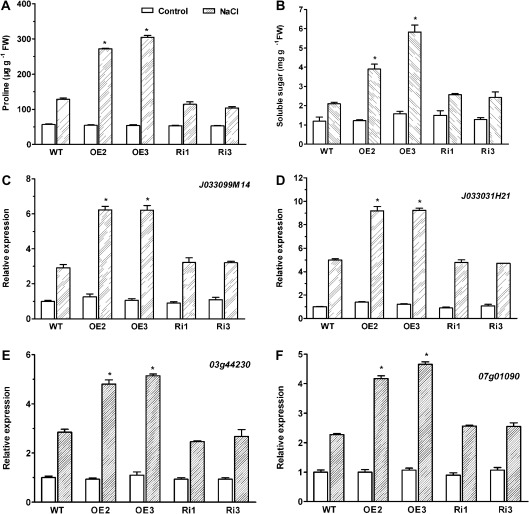
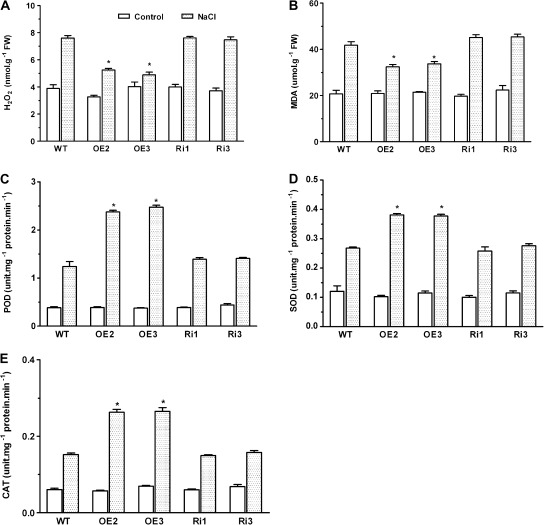
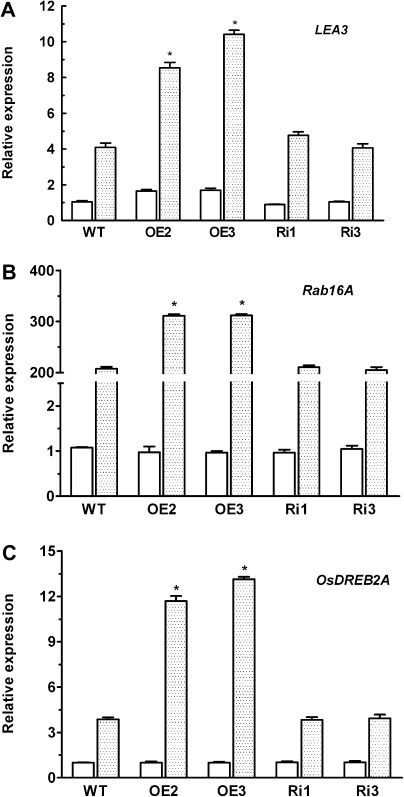
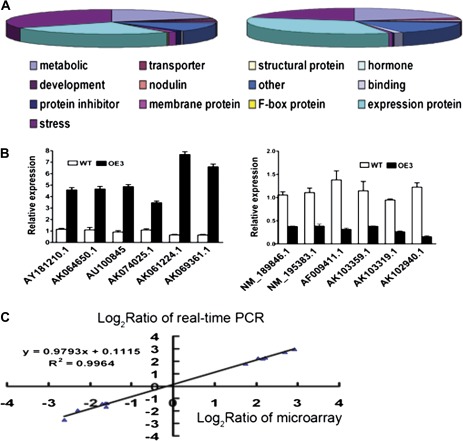
MYB-type transcription factors play a diverse role in plant development and response to abiotic stress. This study isolated a rice R2R3-type MYB gene, OsMYB2, and functionally characterized its role in tolerance to abiotic stress by generating transgenic rice plants with overexpressing and RNA interference OsMYB2. Expression of OsMYB2 was up-regulated by salt, cold, and dehydration stress. OsMYB2 was localized in the nucleus with transactivation activity. No difference in growth and development between the OsMYB2-overexpressing and wild-type plants was observed under normal growth conditions, but the OsMYB2-overexpressing plants were more tolerant to salt, cold, and dehydration stresses and more sensitive to abscisic acid than wild-type plants. The OsMYB2-overexpressing plants accumulated greater amounts of soluble sugars and proline than wild-type plants under salt stress. Overexpression of OsMYB2 enhanced up-regulation of genes encoding proline synthase and transporters. The OsMYB2-overexpressing plants accumulated less amounts of H(2)O(2) and malondialdehyde. The enhanced activities of antioxidant enzymes, including peroxidase, superoxide dismutase, and catalase, may underlie the lower H(2)O(2) contents in OsMYB2-overexpressing plants. There was greater up-regulation of stress-related genes, including OsLEA3, OsRab16A, and OsDREB2A, in the OsMYB2-overexpressing plants. Microarray analysis showed that expression of numerous genes involving diverse functions in stress response was altered in the OsMYB2-overexpressing plants. These findings suggest that OsMYB2 encodes a stress-responsive MYB transcription factor that plays a regulatory role in tolerance of rice to salt, cold, and dehydration stress.


Figures

Fig. 1.
Fig. 1.
Subcellular localization and transactivation analysis of OsMYB2. (A) Nuclear localization of OsMYB2. Confocal images of onion epidermis cells under the GFP channel showing the constitutive localization of GFP (a) and nuclear localization of OsMYB2-GFP (d). The confocal images (b and e) are of the same cells in (a) and (d) with transmitted light. The merged images (c and f) are of (a) and (b) and (d) and (e), respectively. GFP or OsMYB2-GFP fusion was driven by the control of the cauliflower mosaic virus 35S promoter. Onion epidermal peels were bombarded with DNA-coated gold particles and GFP expression was visualized 24 h later. (B) Transactivation assay of OsMYB2 in the yeast strain AH109. Fusion protein of the GAL4 DNA-binding domain and OsMYB2 were expressed in yeast strain AH109. The vector pGBKT7 was expressed in yeast as a control. The culture solution of the transformed yeast was dropped onto SD plates without tryptophan, histidine, or adenine. The plates were incubated for 3 days (upper) and then subjected to β-galactosidase assay (lower). (C) Transactivation assay of OsNAC5 in the yeast strain AH109.
Fig. 2.
Fig. 2.
Real-time reverse-transcription (RT) PCR analysis for the expression of OsMYB2 in rice. (A and B) Time course of OsMYB2 expression during salt (A) and cold and PEG (B) treatments. (C) Expression of OsMYB2 under various hormone treatments. (D) Expression of OsMYB2 in different tissues. Total RNAs were prepared from 14-d-old seedlings of wild-type rice after the above treatments and then reverse-transcribed. The resultant cDNAs were used as templates for real-time RT-PCR and actin was used as an internal control. Data are mean±SE of three biological replicates. Asterisks indicate statistically significant differences (P < 0.05) from controls (0 h in A and B, root in D).
Fig. 3.
Fig. 3.
Molecular characterization and phenotypes of OsMYB2 transgenic rice. (A) OsMYB2 expression in wild-type and transgenic rice. Total RNAs from 14-d-old wild-type and transgenic rice plants were isolated, reverse-transcribed, and analysed by real-time reverse-transcription PCR. Actin was used as an internal control. Error bars are based on three replicates. (B) The phenotypes of the T3 generation of wild-type and transgenic plants after growing on 1/2 MS medium for 14 days. (C) The phenotypes of the T3 generation of wild-type and transgenic plants after growing in soil for 30 days. Data are mean±SE of three biological replicates. Asterisks indicate statistically significant differences (P < 0.05) between wild-type (WT) and transgenic lines (OE and Ri).
Fig. 4.
Fig. 4.
Effect of salt, cold, and dehydration stress on wild-type (WT) and transgenic (OE and Ri) rice plants. (A–D) Phenotypes of wild-type and transgenic rice plants grown on 1/2 MS medium for 14 days and then under normal conditions (A), salt stress (200 mM NaCl for 2 days and normal conditions for 4 days) (B), cold stress (2 °C for 3 days and normal conditions for 7 days) (C), and treatment with 20% PEG for 2 days and recovery for 1 week (D). (E–J) Phenotypes of wild-type and transgenic rice plants grown in soil under normal conditions (E, G, I), subjected to 100 mM NaCl for 10 days and then recovered for another 8 days (F), exposed to 2 °C for 4 days and then recovered for another 6 days (H), and exposed to drought stress for 7 days and then re-watered for 10 days (J). Age of seedlings: 40 d ((E and F), 30 d (G and H) and 60 d (I and J).
Fig. 5.
Fig. 5.
Effect of salt, cold, and dehydration stress on survival rates of wild-type and transgenic rice plants, corresponding to the plants and treatments as shown in Fig. 4. (A–C) Plants grown on 1/2 medium. (D–F) Plants grown in soil. Data are mean±SE of three replicates with total seedling number of 80 for all stress treatments. Values in parentheses are the numbers of survived seedlings/total seedlings used to calculate the survival rate. Asterisks indicate statistically significant differences (P < 0.05) between wild-type (WT) and transgenic lines (OE and Ri).
Fig. 6.
Fig. 6.
Responses of seed germination and seedling growth to treatment with NaCl and abscisic acid (ABA). (A–C) Responses to NaCl treatment: (A) germination rates: T3 generation seeds were soaked in distilled water for 1 day and then allowed to germinate on sterile-water-saturated filter paper with 100 mM NaCl for 5 days; (B) phenotypes: seeds were allowed to germinate in darkness for 2 days, and then transferred to 1/2 MS medium containing 150 mM NaCl under 28/25 °C (day/night) with a 14-h photoperiod for 12 days; (C) shoot heights of seedlings under normal and 150 mM NaCl conditions. (D–F) Responses to ABA treatment: (D) germination rates: T3 generation seeds were soaked in distilled water for 1 day and then allowed to germinate on sterile-water-saturated filter paper with 4 μM ABA for 5 days; (E) phenotypes: seeds were allowed to germinate in darkness for 2 days, and then transferred to 1/2 MS medium containing 4 μM ABA under 28/25 °C (day/night) with a 14-h photoperiod for 12 days; (F) shoot heights of seedlings under normal and 4 μM ABA conditions. Data are mean±SE of three replicates. Asterisks indicate statistically significant differences (P < 0.05) between wild-type (WT) and transgenic lines (OE and Ri). (This figure is available in colour at JXB online.)
Fig. 7.
Fig. 7.
Effect of salt stress on contents of proline and soluble sugars and gene expression in wild-type and transgenic rice plants. (A and B) Wild-type and transgenic rice seedlings of 14-d-old were exposed to 200 mM NaCl for 2 days and then collected for determination of proline (A) and soluble sugars (B) contents. (C–F) Expression levels of putative proline synthase genes (J033099M14 and J033031H21; C and D) and transporter genes (03g44230 and 07g01090; E–F) in transgenic and wild-type plants. Total RNA was extracted from the 14-d-old rice seedlings grown under control and salt stress (200 mM NaCl) conditions for 24 hours. The transcript levels were measured by real-time reverse-transcription PCR. Actin was used as an internal control. Data are mean±SE of three replicates. Asterisks indicate statistically significant differences (P < 0.05) between wild-type (WT) and transgenic lines (OE and Ri). The accession numbers of the sequences of J033099M14, J033031H21, 03g44230, and 07g01090 are AK102633, AK101230, AK067118, and AK0666298.
Fig. 8.
Fig. 8.
Effect of salt stress on contents of oxidants (A and B) and antioxidant enzymes (C–D) in wild-type and transgenic rice plants. (A and B) Plants were exposed to 200 mM NaCl for 2 days before determination of H2O2 (A) and malondialdehyde (MDA) (B). (C–E) were exposed to 200 mM NaCl for 24 hours and before determination of peroxidase (POD; C), superoxide dismutase (SOD; D), and catalase (CAT; E). Data are mean±SE of three replicates. Asterisks indicate statistically significant differences (P < 0.05) between wild-type (WT) and transgenic lines (OE and Ri).
Fig. 9.
Fig. 9.
Expression levels of some salt-responsive genes in wild-type and transgenic plants. (A) OsLEA3; (B) OsRab16A; (C) OsDREB2A. Total RNA was extracted from the 14-d-old rice seedlings grown under control (open columns) and salt stress (200 mM NaCl, filled columns) conditions for 24 hours. The transcript levels were measured by real-time reverse-transcription PCR. Actin was used as an internal control. Data are mean±SE of three replicates. Asterisks indicate statistically significant differences (P < 0.05) between wild-type (WT) and transgenic lines (OE and Ri).
Fig. 10.
Fig. 10.
Global analysis of gene expression in OsMYB2-overexpressing rice (transgenic line OE3). (A) Predicted functions of the proteins encoded by up-regulated genes (left) and down-regulated genes (right). (B) Relative expression in the wild type and the transgenic line of six up-regulated genes (left) and six down-regulated genes (right) selected from the microarray data and confirmed by real-time reverse-transcription (RT) PCR. (C) Correlation between data obtained from microarray and RT-PCR data. Data are mean±SE of three replicates.

Similar articles

Cited by

References

    1. Abe H, Urao T, Ito T, Seki M, Shinozaki K, Yamaguchi-Shinozaki K. Arabidopsis AtMYC2 (bHLH) and AtMYB2 (MYB) function as transcriptional activators in abscisic acid signaling. The Plant Cell. 2003;15:63–78. - PMC - PubMed
    1. Agarwal M, Hao Y, Kapoor A, Dong CH, Fujii H, Zheng X, Zhu JK. A R2R3 type MYB transcription factor is involved in the cold regulation of CBF genes and in acquired freezing tolerance. Journal of Biological Chemistry. 2006;281:37636–37645. - PubMed
    1. Alexieva V, Sergiev I, Mapelli S, Karanov E. The effect of drought and ultraviolet radiation on growth and stress markers in pea and wheat. Plant, Cell and Environment. 2001;24:1337–1344.
    1. Armengaud P, Thiery L, Buhot N, Grenier-De March G, Savoure A. Transcriptional regulation of proline biosynthesis in Medicago truncatula reveals developmental and environmental specific features. Physiologia Plantarum. 2004;120:442–450. - PubMed
    1. Bailey RW. Reaction of pentoses with anthrone. Biochemical Journal. 1958;68:669–672. - PMC - PubMed

Publication types