

Protein kinase C-α mediates hypertonicity-stimulated increase in urea transporter phosphorylation in the inner medullary collecting duct
- PMID: 22301620
- PMCID: PMC3362171
- DOI: 10.1152/ajprenal.00664.2011
Protein kinase C-α mediates hypertonicity-stimulated increase in urea transporter phosphorylation in the inner medullary collecting duct
Abstract
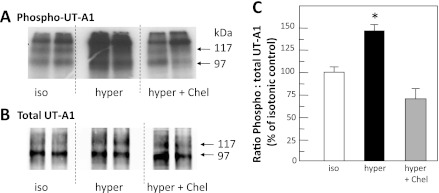
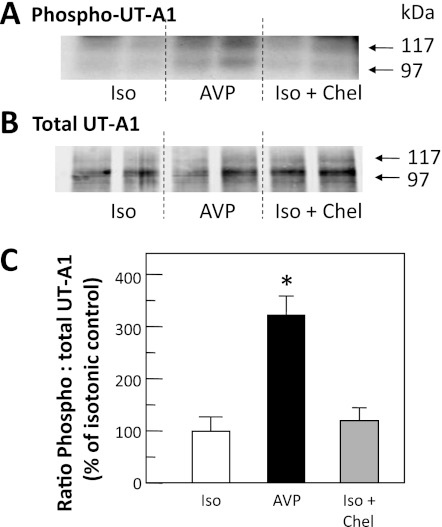
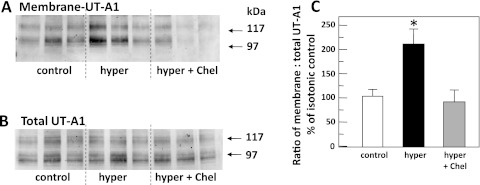
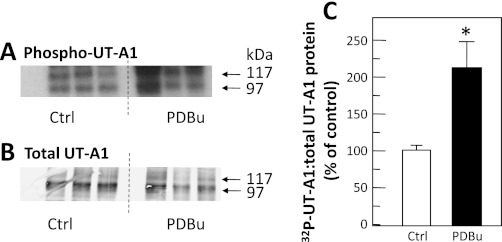
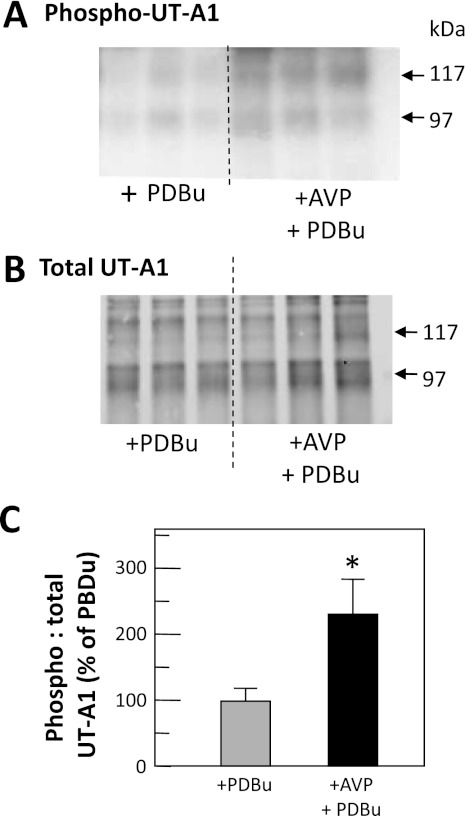
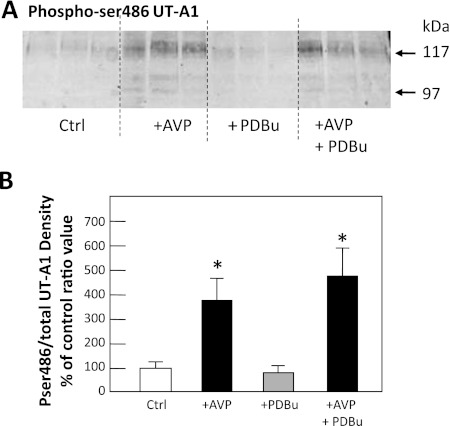
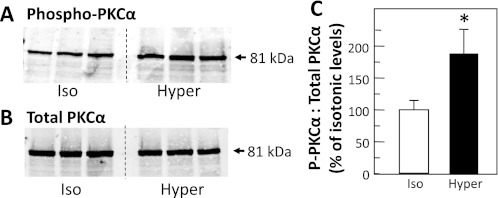
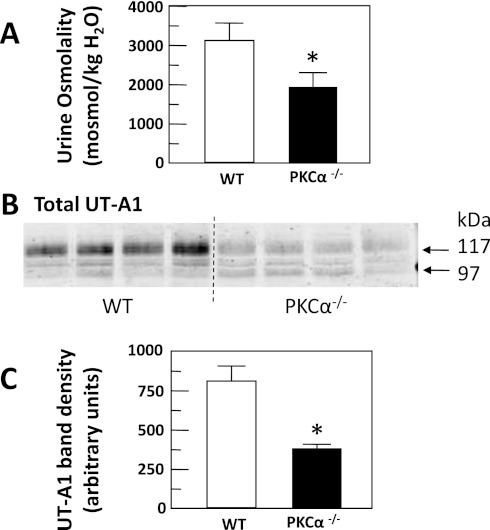
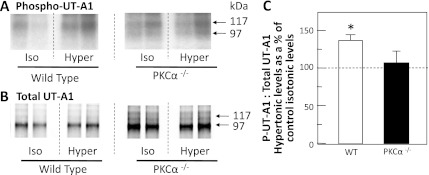
The UT-A1 urea transporter plays a critical role in the production of concentrated urine. Both vasopressin and hypertonicity increase urea permeability in rat terminal inner medullary collecting ducts (IMCD). Each agonist independently increases UT-A1 phosphorylation and apical plasma membrane accumulation. Vasopressin activates PKA and phosphorylates UT-A1 at serines 486 and 499. Hypertonicity stimulates urea permeability through protein kinase C (PKC) and intracellular calcium. To determine whether the hypertonic stimulation of urea permeability results from a PKC-mediated phosphorylation of UT-A1, rat IMCDs were metabolically labeled with [(32)P]. Hypertonicity stimulated UT-A1 phosphorylation, and this increase was blocked by preincubation with a PKC inhibitor. IMCDs were biotinylated to assess plasma membrane UT-A1. Hypertonicity increased biotinylated UT-A1, and this increase was blocked by preincubation with a PKC inhibitor. When PKC was directly activated using a phorbol ester, total UT-A1 phosphorylation increased, but phosphorylation at serine 486 was not increased, indicating that PKC did not phosphorylate UT-A1 at the same residue as PKA. Since PKC-α is a calcium-dependent PKC isoform and PKC-α knockout mice have a urine-concentrating defect, it suggested that PKC-α may mediate the response to hypertonicity. Consistent with this hypothesis, hypertonicity increased phospho-PKC-α in rat IMCDs. Finally, PKC-α knockout mice were used to determine whether hypertonicity could stimulate UT-A1 phosphorylation in the absence of PKC-α. Hypertonicity significantly increased UT-A1 phosphorylation in wild-type mice but not in PKC-α knockout mice. We conclude that PKC-α mediates the hypertonicity-stimulated increase in UT-A1 phosphorylation in the IMCD.
Figures
Similar articles
-
Role of protein kinase C-α in hypertonicity-stimulated urea permeability in mouse inner medullary collecting ducts.Am J Physiol Renal Physiol. 2013 Jan 15;304(2):F233-8. doi: 10.1152/ajprenal.00484.2012. Epub 2012 Oct 24. Am J Physiol Renal Physiol. 2013. PMID: 23097465 Free PMC article.
-
Activation of protein kinase Cα increases phosphorylation of the UT-A1 urea transporter at serine 494 in the inner medullary collecting duct.Am J Physiol Cell Physiol. 2015 Nov 1;309(9):C608-15. doi: 10.1152/ajpcell.00171.2014. Epub 2015 Sep 2. Am J Physiol Cell Physiol. 2015. PMID: 26333598 Free PMC article.
-
Protein kinase C regulates urea permeability in the rat inner medullary collecting duct.Am J Physiol Renal Physiol. 2010 Dec;299(6):F1401-6. doi: 10.1152/ajprenal.00322.2010. Epub 2010 Sep 22. Am J Physiol Renal Physiol. 2010. PMID: 20861079 Free PMC article.
-
Biochemical properties of urea transporters.Subcell Biochem. 2014;73:109-26. doi: 10.1007/978-94-017-9343-8_7. Subcell Biochem. 2014. PMID: 25298341 Review.
-
Biochemical Modification and Subcellular Trafficking of Urea Transporters.Subcell Biochem. 2025;118:63-85. doi: 10.1007/978-981-96-6898-4_4. Subcell Biochem. 2025. PMID: 40637977 Review.
Cited by
-
Role of protein kinase C-α in hypertonicity-stimulated urea permeability in mouse inner medullary collecting ducts.Am J Physiol Renal Physiol. 2013 Jan 15;304(2):F233-8. doi: 10.1152/ajprenal.00484.2012. Epub 2012 Oct 24. Am J Physiol Renal Physiol. 2013. PMID: 23097465 Free PMC article.
-
Pendrin localizes to the adrenal medulla and modulates catecholamine release.Am J Physiol Endocrinol Metab. 2015 Sep 15;309(6):E534-45. doi: 10.1152/ajpendo.00035.2015. Epub 2015 Jul 14. Am J Physiol Endocrinol Metab. 2015. PMID: 26173457 Free PMC article.
-
Hyperosmolality regulates UT-A6 urea transporter expression in the Caco-2 cell line.Physiol Rep. 2016 Sep;4(18):e12984. doi: 10.14814/phy2.12984. Physiol Rep. 2016. PMID: 27670410 Free PMC article.
-
Mammalian urine concentration: a review of renal medullary architecture and membrane transporters.J Comp Physiol B. 2018 Nov;188(6):899-918. doi: 10.1007/s00360-018-1164-3. Epub 2018 May 24. J Comp Physiol B. 2018. PMID: 29797052 Free PMC article. Review.
-
PKC-α contributes to high NaCl-induced activation of NFAT5 (TonEBP/OREBP) through MAPK ERK1/2.Am J Physiol Renal Physiol. 2015 Jan 15;308(2):F140-8. doi: 10.1152/ajprenal.00471.2014. Epub 2014 Nov 12. Am J Physiol Renal Physiol. 2015. PMID: 25391900 Free PMC article.
References
-
- Blount MA, Klein JD, Martin CF, Tchapyjnikov D, Sands JM. Forskolin stimulates phosphorylation and membrane accumulation of UT-A3. Am J Physiol Renal Physiol 293: F1308–F1313, 2007 - PubMed
-
- Braz JC, Gregory K, Pathak A, Zhao W, Sahin B, Klevitsky R, Kimball TF, Lorenz JN, Nairn AC, Liggett SB, Bodi I, Wang S, Schwartz A, Lakatta EG, DePaoli-Roach AA, Robbins J, Hewett TE, Bibb JA, Westfall MV, Kranias EG, Molkentin JD. PKC-a regulates cardiac contractility and propensity toward heart failure. Nat Med 10: 248–254, 2004 - PubMed
Publication types
MeSH terms
Substances
Grants and funding
LinkOut - more resources
Full Text Sources
Molecular Biology Databases
Research Materials