Comparative Study
. 2012 Feb;41(2):143-51.
doi: 10.1259/dmfr/21825064.

Perineural spread of adenoid cystic carcinoma in the oral and maxillofacial regions: evaluation with contrast-enhanced CT and MRI

Affiliations
Comparative Study

Perineural spread of adenoid cystic carcinoma in the oral and maxillofacial regions: evaluation with contrast-enhanced CT and MRI

H Shimamoto et al. Dentomaxillofac Radiol. 2012 Feb.

Abstract

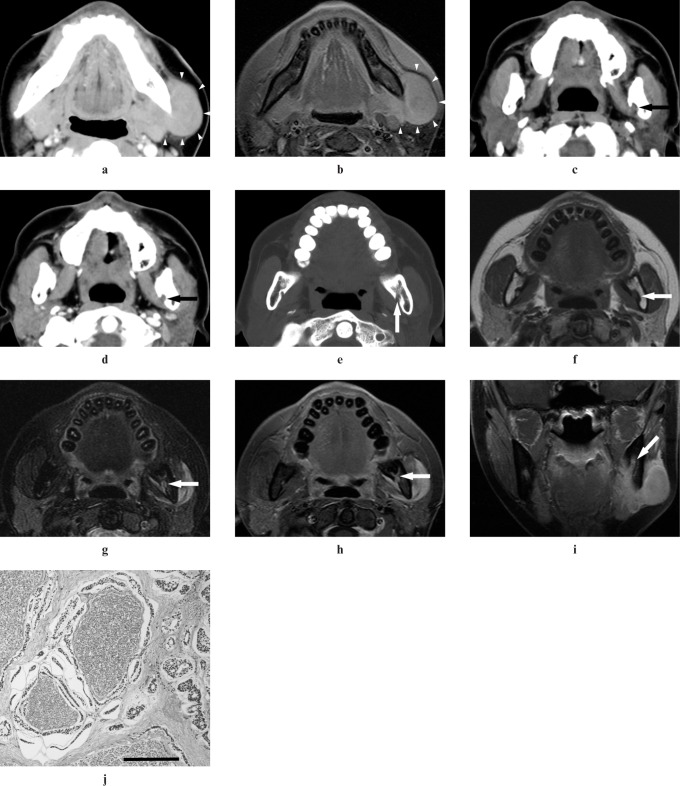
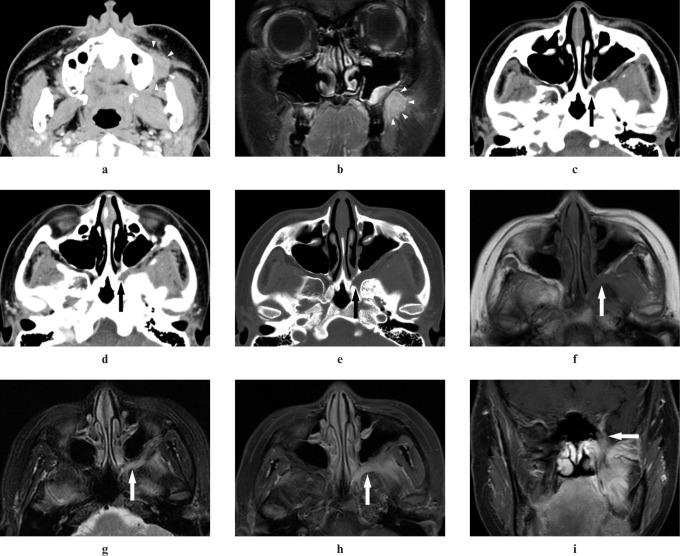
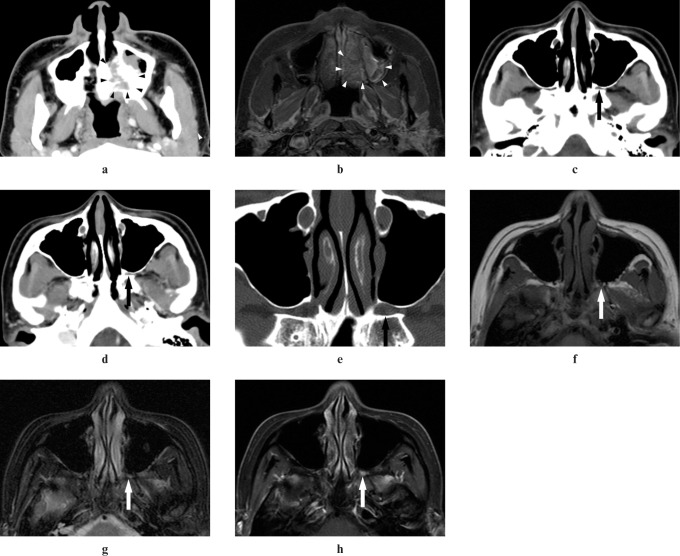
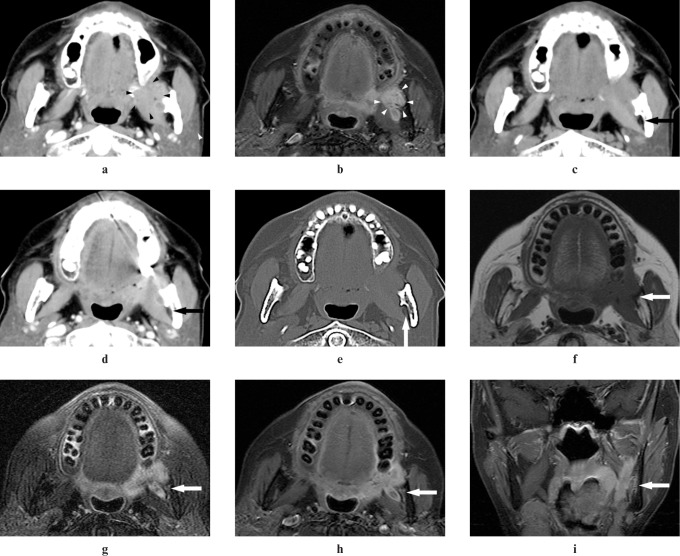
Objectives: The objective of this study was to compare the accuracy of contrast-enhanced CT (CECT) and contrast-enhanced MRI (CEMRI) in the detection of perineural spread (PNS) of adenoid cystic carcinoma (ACC) in the oral and maxillofacial regions.

Methods: This study consisted of 13 ACCs from 13 patients, all of which were histopathologically diagnosed. Both CECT and CEMRI were performed in all patients before the treatment. The images of each patient were retrospectively evaluated for the detection of PNS. The definitions of PNS included abnormal density/signal intensity, contrast enhancement or widening of the pterygopalatine fossa, palatine foramen, incisive canal, mandibular foramen and mandibular canal, and enlargement or excessive contrast enhancement of a nerve.

Results: 11 out of 13 cases were proven to exhibit PNS histopathologically. 8 of the 11 cases for which PNS was histopathologically proven exhibited PNS on MR images. Six of the eight cases for which PNS was exhibited on MR images also exhibited PNS on CT images. The sensitivity, specificity and accuracy for the detection of PNS were 55%, 100% and 62% on CT images and 73%, 100% and 77% on MR images, respectively. Although the accuracy of PNS on MR images was slightly superior to that on CT images, there were no statistically significant differences between the detection of PNS on CT images and on MR images.

Conclusions: CT and MR images are equally useful for the detection of PNS of ACC in the oral and maxillofacial regions.


Figures

Figure 1
Figure 1
Adenoid cystic carcinoma (ACC) of the left angle of mandible in a 29-year-old female (Case 1). (a,b) A well-defined-margin tumour in the left angle of mandible can be detected on CT and MR images (arrowheads). (c) A plain CT image shows obliteration of fat compared with the right side in the left mandibular foramen (arrow). (d) A contrast-enhanced CT image shows inhomogeneous enhancement in the left mandibular foramen (arrow). (e) A reformatted CT image with bone algorithm shows widening of the left mandibular foramen (arrow). (f) A T1 weighted MR image shows intermediate signal intensity the same as that of adjacent muscle in the left mandibular foramen (arrow). (g) A T2 weighted MR image with the fat suppression (FS) technique shows higher signal intensity than that of adjacent muscle in the left mandibular foramen (arrow). (h,i) Contrast-enhanced T1 weighted MR images with the FS technique show contrast enhancement of the left mandibular foramen (arrows). (j) A histopathologic section shows perineural spread of tumour cells along the inferior alveolar nerve and infiltration of cribriform-type ACC cells for the surrounding tissues (bar 200 μm)
Figure 2
Figure 2
Adenoid cystic carcinoma of the left cheek in a 27-year-old female (Case 2). (a,b) An ill-defined-margin tumour in the left cheek can be detected on CT and MR images (arrowheads). (c) A plain CT image shows obliteration of fat in the left pterygopalatine fossa (arrow). (d) A contrast-enhanced CT image shows inhomogeneous enhancement in the left pterygopalatine fossa (arrow). (e) A reformatted CT image with bone algorithm shows widening of the left pterygopalatine fossa (arrow). (f) A T1 weighted MR image shows intermediate signal intensity the same as that of adjacent muscle in the left pterygopalatine fossa (arrow). (g) A T2 weighted MR image with the fat suppression (FS) technique shows higher signal intensity than that of adjacent muscle in the left pterygopalatine fossa (arrow). (h,i) A contrast-enhanced T1 weighted MR image with the FS technique shows inhomogeneous enhancement of the left pterygopalatine fossa (arrows)
Figure 3
Figure 3
Adenoid cystic carcinoma of the left palate in a 37-year-old female (Case 7). (a,b) An ill-defined margin tumour in the left palate can be detected on CT and MR images (arrowheads). (c) A plain CT image does not show elevation of CT value in the left pterygopalatine fossa (arrow). (d) A contrast-enhanced CT image does not show contrast enhancement in the left pterygopalatine fossa (arrow). (e) A plain CT image with bone window does not show widening of the left pterygopalatine fossa (arrow). (f,g) T1 weighted and T2 weighted MR images with the fat suppression (FS) technique do not show abnormal signal intensity in the left pterygopalatine fossa (arrows). (h) However, a contrast-emhanced T1 weighted MR image with the FS technique shows abnormal enhancement of the left pterygopalatine fossa (arrow)
Figure 4
Figure 4
Adenoid cystic carcinoma of the left retromolar in a 72-year-old female (Case 8). (a,b) An ill-defined margin tumour in the left retromolar can be detected on CT and MR images (arrowheads). (c) A plain CT image does not show elevation of CT value in the left mandibular foramen (arrow). (d) A contrast-enhanced CT image does not show inhomogeneous enhancement in the left mandibular foramen (arrow). (e) A reformatted CT image with bone algorithm does not show widening of the left mandibular foramen (arrow). (f) A T1 weighted MR image shows intermediate signal intensity the same as that of adjacent muscle in the left mandibular foramen and the left mandibular canal (arrow). (g) A T2 weighted MR image with the fat suppression (FS) technique shows higher signal intensity than that of adjacent muscle in the left mandibular foramen and the left mandibular canal and widening of the left mandibular foramen (arrow). (h,i) Contrast-enhanced T1 weighted MR images with the FS technique show contrast enhancement of the left mandibular foramen and the left mandibular canal and widening of the left mandibular foramen (arrows)

References

    1. Kim KH, Sung MW, Chung PS, Rhee CS, Park CI, Kim WH. Adenoid cystic carcinoma of the head and neck. Arch Otolaryngol Head Neck Surg 1994;120:721–726 - PubMed
    1. Iseli TA, Karnell LH, Graham SM, Funk GF, Buatti JM, Gupta AK, et al. Role of radiotherapy in adenoid cystic carcinoma of the head and neck. J Laryngol Otol 2009;123:1137–1144 - PubMed
    1. Spiro RH, Huvos AG, Strong EW. Adenoid cystic carcinoma of salivary origin. A clinicopathologic study of 242 cases. Am J Surg 1974;128:512–520 - PubMed
    1. Hanna E, Vural E, Prokopakis E, Carrau R, Snyderman C, Weissman J. The sensitivity and specificity of high-resolution imaging in evaluating perineural spread of adenoid cystic carcinoma to the skull base. Arch Otolaryngol Head Neck Surg 2007;133:541–545 - PubMed
    1. Arcas A, Bescos S, Raspall G, Capellades J. Perineural spread of epidermoid carcinoma in the infraorbital nerve: case report. J Oral Maxillofac Surg 1996;54:520–522 - PubMed

MeSH terms