

Sleep in the rock hyrax, Procavia capensis
- PMID: 22301688
- PMCID: PMC7065316
- DOI: 10.1159/000335342
Sleep in the rock hyrax, Procavia capensis
Abstract
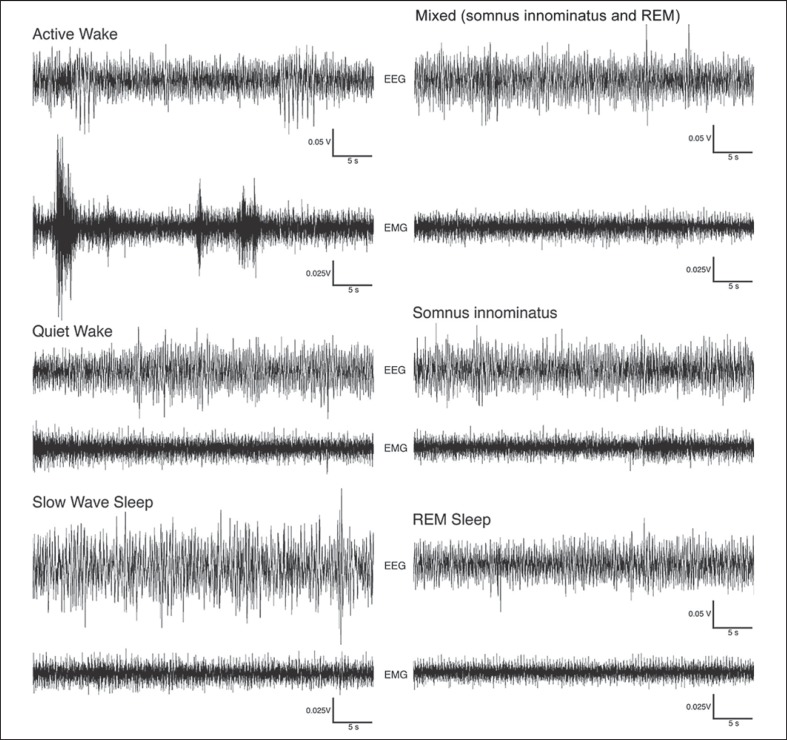
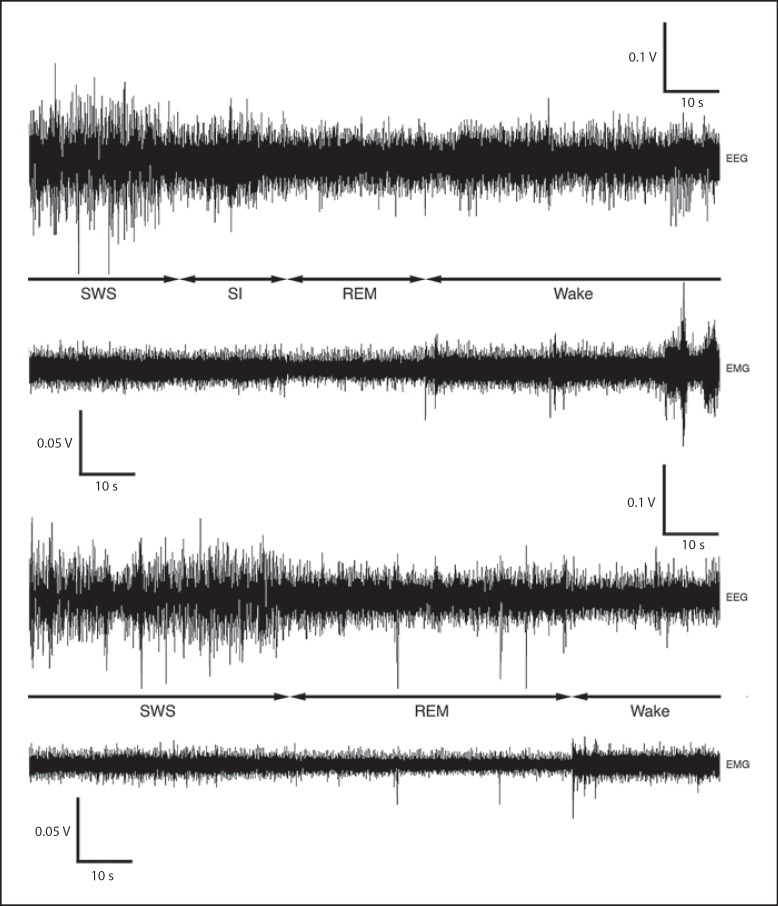
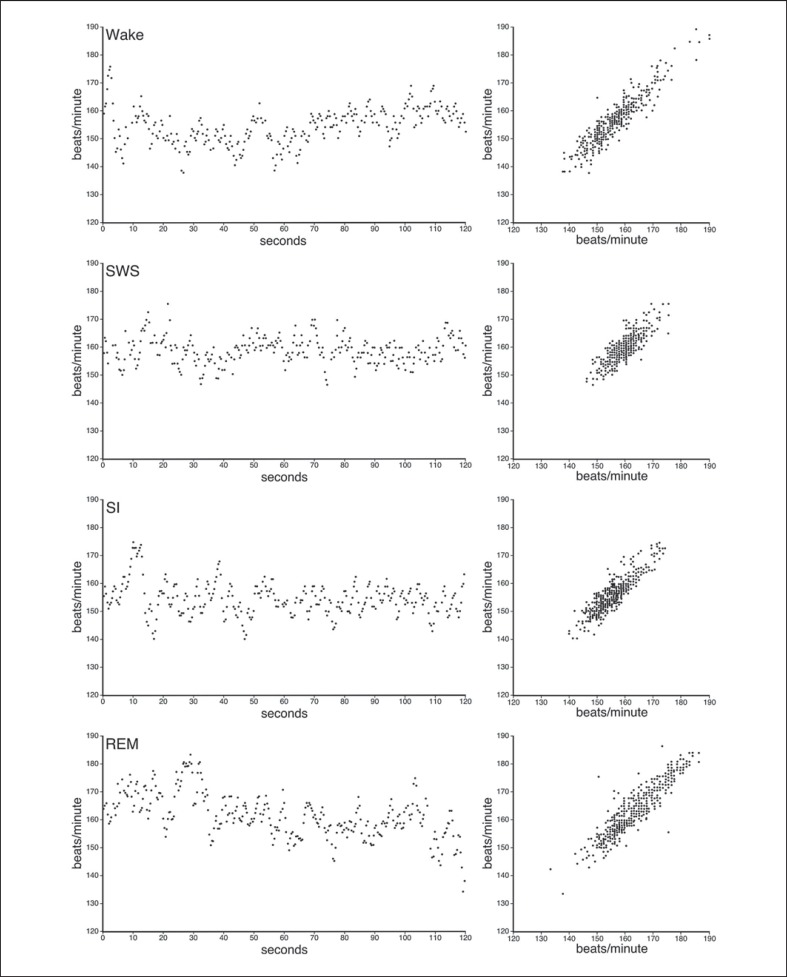
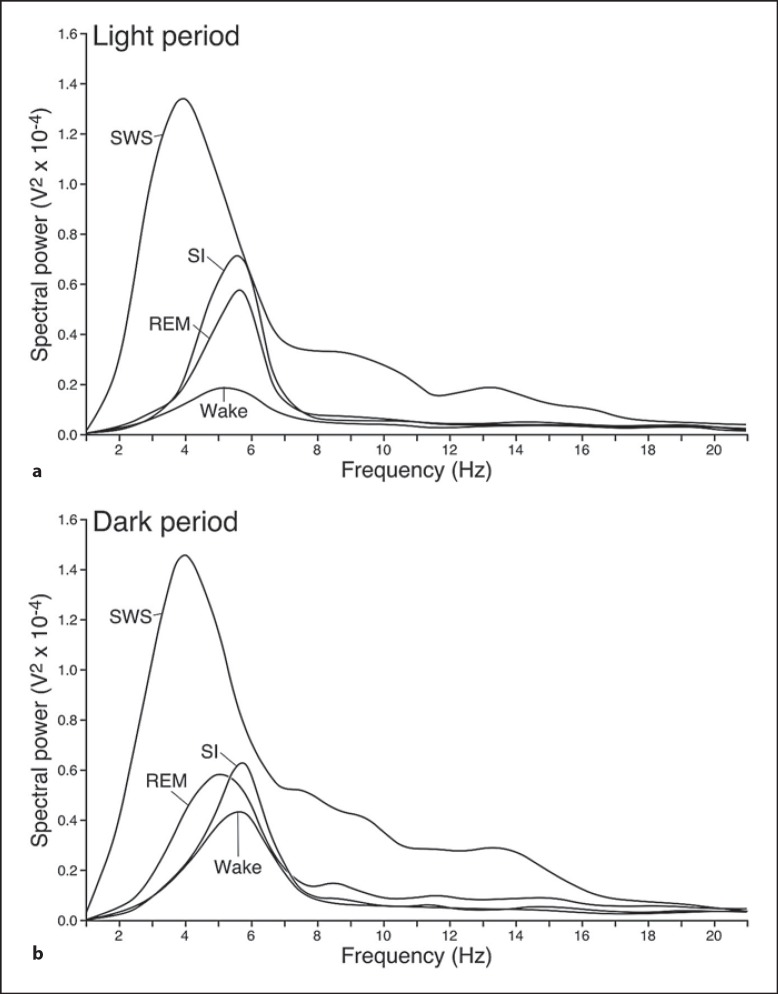
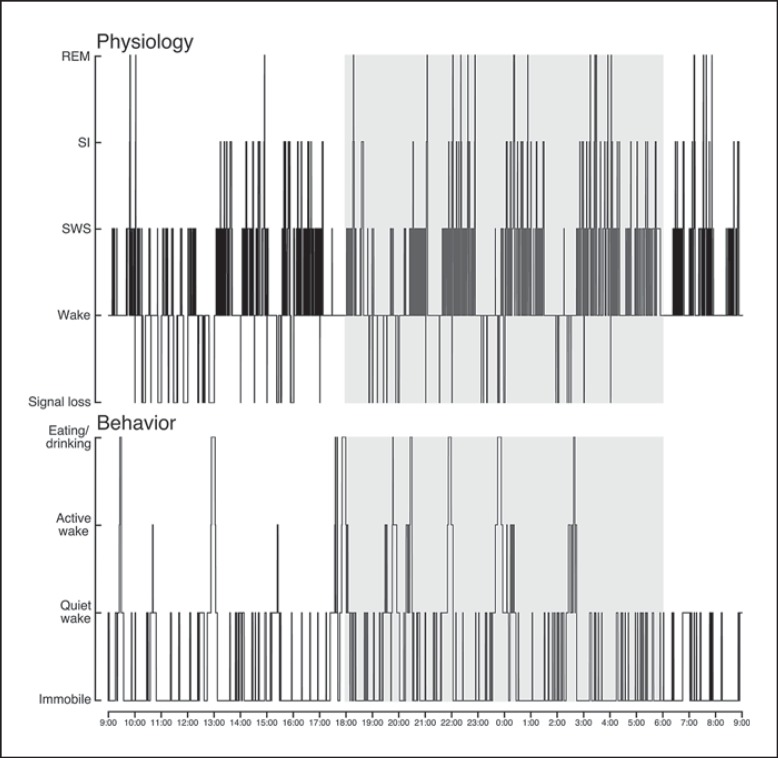
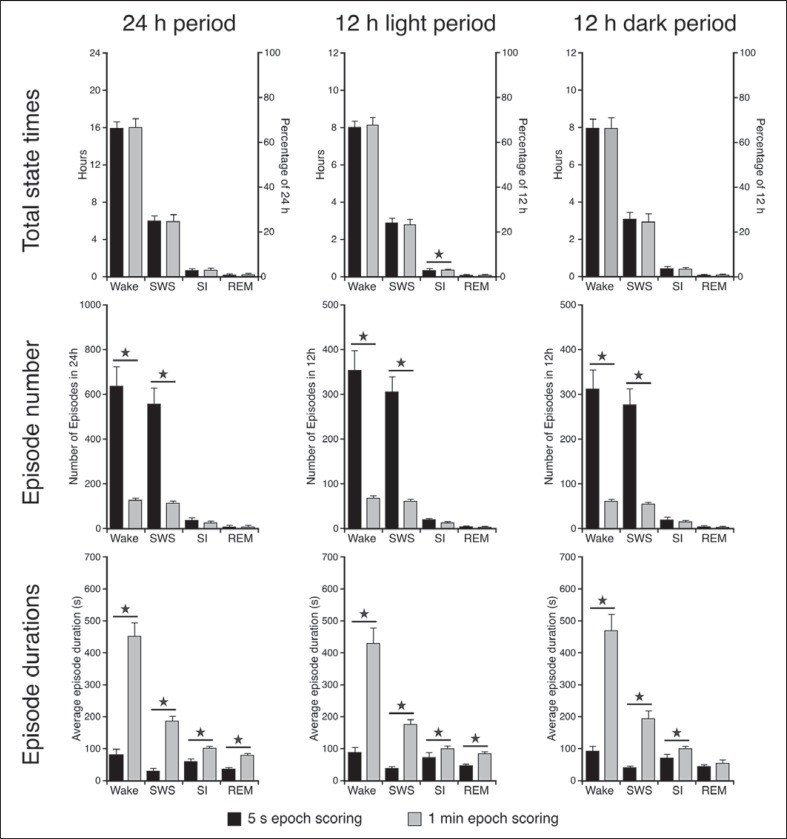
We investigated sleep in therock hyrax, Procavia capensis, a social mammal that typically lives in colonies on rocky outcrops throughout most parts of Southern Africa. The sleep of 5 wild-captured, adult rock hyraxes was recorded continuously for 72 h using telemetric relay of signals and allowing unimpeded movement. In addition to waking, slow wave sleep (SWS) and an unambiguous rapid eye movement (REM) state, a sleep state termed somnus innominatus (SI), characterized by low-voltage, high-frequency electroencephalogram, an electromyogram that stayed at the same amplitude as the preceding SWS episode and a mostly regular heart rate, were identified. If SI can be considered a form of low-voltage non-REM, the implication would be that the rock hyrax exhibits the lowest amount of REM recorded for any terrestrial mammal studied to date. Conversely, if SI is a form of REM sleep, it would lead to the classification of a novel subdivision of this state; however, further investigation would be required. The hyraxes spent on average 15.89 h (66.2%) of the time awake, 6.02 h (25.1%) in SWS, 43 min (3%) in SI and 6 min (0.4%) in REM. The unambiguous REM sleep amounts were on average less than 6 min/day. The most common state transition pathway in these animals was found to be wake → SWS → wake. No significant differences were noted with regard to total sleep time, number of episodes and episode duration for all states between the light and dark periods.Thus, prior classification of the rock hyrax as strongly diurnal does not appear to hold under controlled laboratory conditions.
Copyright © 2012 S. Karger AG, Basel.
Figures

Similar articles
-
Sociality Affects REM Sleep Episode Duration Under Controlled Laboratory Conditions in the Rock Hyrax, Procavia capensis.Front Neuroanat. 2017 Nov 16;11:105. doi: 10.3389/fnana.2017.00105. eCollection 2017. Front Neuroanat. 2017. PMID: 29201001 Free PMC article.
-
Sleep in the Cape Mole Rat: A Short-Sleeping Subterranean Rodent.Brain Behav Evol. 2016;87(2):78-87. doi: 10.1159/000444742. Epub 2016 Apr 19. Brain Behav Evol. 2016. PMID: 27088160
-
Regional cerebral blood flow throughout the sleep-wake cycle. An H2(15)O PET study.Brain. 1997 Jul;120 ( Pt 7):1173-97. doi: 10.1093/brain/120.7.1173. Brain. 1997. PMID: 9236630
-
Seasonal patterns in body temperature of free-living rock hyrax (Procavia capensis).Comp Biochem Physiol A Mol Integr Physiol. 2006 Jan;143(1):42-9. doi: 10.1016/j.cbpa.2005.10.020. Epub 2005 Nov 23. Comp Biochem Physiol A Mol Integr Physiol. 2006. PMID: 16309938
-
Pulmonary silicosis in 2 rock hyraxes, and literature review.J Vet Diagn Invest. 2022 Jan;34(1):98-101. doi: 10.1177/10406387211057524. Epub 2021 Nov 15. J Vet Diagn Invest. 2022. PMID: 34781790 Free PMC article. Review.
Cited by
-
Sociality Affects REM Sleep Episode Duration Under Controlled Laboratory Conditions in the Rock Hyrax, Procavia capensis.Front Neuroanat. 2017 Nov 16;11:105. doi: 10.3389/fnana.2017.00105. eCollection 2017. Front Neuroanat. 2017. PMID: 29201001 Free PMC article.
-
High-resolution tracking of hyrax social interactions highlights nighttime drivers of animal sociality.Commun Biol. 2022 Dec 15;5(1):1378. doi: 10.1038/s42003-022-04317-5. Commun Biol. 2022. PMID: 36522486 Free PMC article.
-
Do all mammals dream?J Comp Neurol. 2020 Dec 1;528(17):3198-3204. doi: 10.1002/cne.24860. Epub 2020 Jan 29. J Comp Neurol. 2020. PMID: 31960424 Free PMC article. Review.
-
Sleep in the East African root rat, Tachyoryctes splendens.J Exp Zool A Ecol Integr Physiol. 2024 Dec;341(10):1111-1120. doi: 10.1002/jez.2839. Epub 2024 Jun 3. J Exp Zool A Ecol Integr Physiol. 2024. PMID: 38828695 Free PMC article.
-
Organization of the sleep-related neural systems in the brain of the river hippopotamus (Hippopotamus amphibius): A most unusual cetartiodactyl species.J Comp Neurol. 2016 Jul 1;524(10):2036-58. doi: 10.1002/cne.23930. Epub 2016 Feb 18. J Comp Neurol. 2016. PMID: 26588600 Free PMC article.
References
-
- Affanni JM. Observations on the sleep of some South American marsupials and edentates. In: Chase M, The Sleeping Brain, editor. Los Angeles, Brain Research Institute, University of California. 1972. pp. pp 21–23.
-
- Allison T, Cicchetti PV. Sleep in mammals: ecological and constitutional correlates. Science. 1976;194:732–734. - PubMed
-
- Berger RJ, Walker JM. A polygraphic study of sleep in the tree shrew (Tupaia glis) Brain Behav Evol. 1972;5:54–69. - PubMed
-
- Bergmann BM, Winter JB, Rosenberg RS, Rechtschaffen A. NREM sleep with low-voltage EEG in the rat. Sleep. 1987;10:1–11. - PubMed
-
- Campbell SS, Tobler I. Animal sleep: a review of sleep duration across phylogeny. Neurosci Biobehav Rev. 1984;8:296–300. - PubMed
Publication types
MeSH terms
Grants and funding
LinkOut - more resources
Full Text Sources
