

Relation between holiday weight gain and total energy expenditure among 40- to 69-y-old men and women (OPEN study)
- PMID: 22301936
- PMCID: PMC3278247
- DOI: 10.3945/ajcn.111.023036
Relation between holiday weight gain and total energy expenditure among 40- to 69-y-old men and women (OPEN study)
Abstract
Background: A significant proportion of the average annual body weight (BW) gain in US adults (~0.5-1 kg/y) may result from modest episodes of positive energy balance during the winter holiday season.
Objective: We tested whether holiday BW gain was reduced in participants with high baseline total energy expenditure (TEE) or whether it varied by BMI (in kg/m(2)).
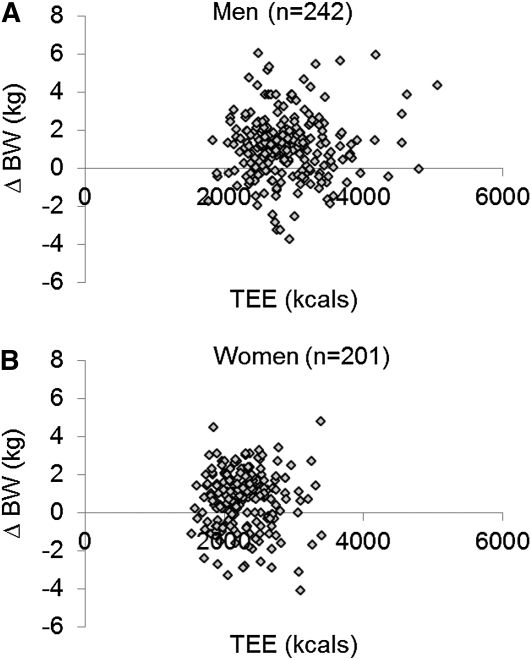
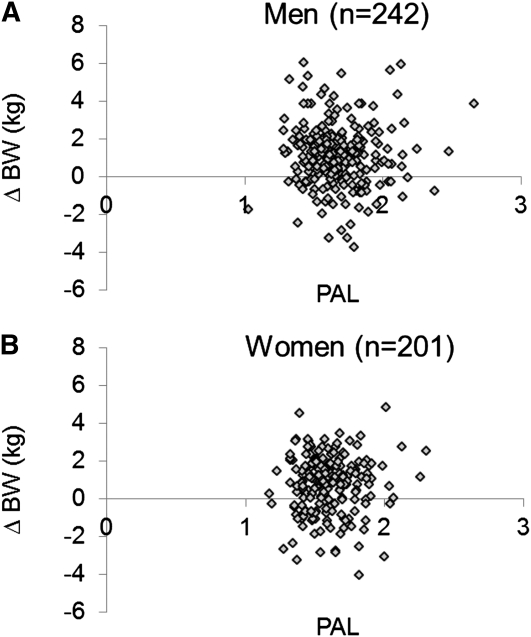
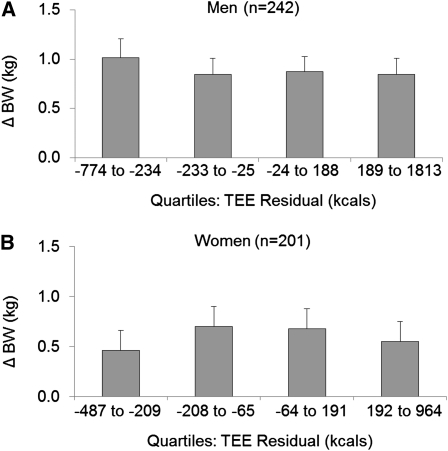
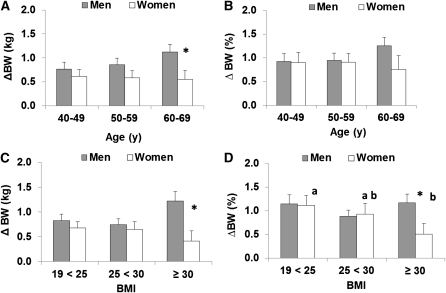
Design: In a secondary analysis of previously published data, ΔBW normalized over 90 d from mid-September/mid-October 1999 to mid-January/early March 2000 was analyzed by sex, age, and BMI in 443 men and women (40-69 y of age). TEE was measured by doubly labeled water. High or low energy expenditure was assessed as residual TEE after linear adjustment for age, height, and BW.
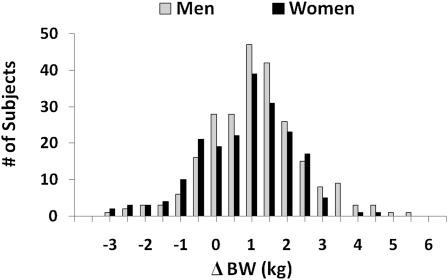
Results: No correlations between ΔBW and TEE or TEE residuals were found. Sixty-five percent of men and 58% of women gained ≥0.5 kg BW, with ~50% of both groups gaining ≥1% of preholiday BW. Obese men (BMI ≥30) gained more BW than did obese women.
Conclusions: A high preholiday absolute TEE or residual TEE did not protect against BW gain during the winter holiday quarter. It is not known whether higher than these typical TEE levels would protect against weight gain or if the observed gain may be attributed to increased food consumption and/or reduced physical activity during the holiday quarter.
Figures
Similar articles
-
Change in eating pattern as a contributor to energy intake and weight gain during the winter holiday period in obese adults.Int J Obes (Lond). 2020 Jul;44(7):1586-1595. doi: 10.1038/s41366-020-0562-2. Epub 2020 Mar 13. Int J Obes (Lond). 2020. PMID: 32203107 Free PMC article.
-
Comparison of total energy expenditure between school and summer months.Pediatr Obes. 2013 Oct;8(5):404-10. doi: 10.1111/j.2047-6310.2012.00120.x. Epub 2013 May 2. Pediatr Obes. 2013. PMID: 23637099 Free PMC article.
-
A prospective study of holiday weight gain.N Engl J Med. 2000 Mar 23;342(12):861-7. doi: 10.1056/NEJM200003233421206. N Engl J Med. 2000. PMID: 10727591 Free PMC article.
-
Holiday weight gain: fact or fiction?Nutr Rev. 2000 Dec;58(12):378-9. doi: 10.1111/j.1753-4887.2000.tb01839.x. Nutr Rev. 2000. PMID: 11206847 Review.
-
Balancing energy expenditure and body weight.Am J Clin Nutr. 1998 Oct;68(4):956S-961S. doi: 10.1093/ajcn/68.4.956S. Am J Clin Nutr. 1998. PMID: 9771879 Review.
Cited by
-
The effect of COVID-19 lockdown on Iraqi wrestlers.J Med Life. 2022 Aug;15(8):963-966. doi: 10.25122/jml-2021-0356. J Med Life. 2022. PMID: 36188653 Free PMC article.
-
The Relationship Between Feasting Periods and Weight Gain: a Systematic Scoping Review.Curr Obes Rep. 2020 Mar;9(1):39-62. doi: 10.1007/s13679-020-00370-5. Curr Obes Rep. 2020. PMID: 31953670
-
The Association of Physical Activity during Weekdays and Weekend with Body Composition in Young Adults.J Obes. 2016;2016:8236439. doi: 10.1155/2016/8236439. Epub 2016 Apr 20. J Obes. 2016. PMID: 27200185 Free PMC article.
-
The effect of Norouz holiday on anthropometric measures and body composition.J Diabetes Metab Disord. 2015 Feb 25;14:7. doi: 10.1186/s40200-015-0134-5. eCollection 2015. J Diabetes Metab Disord. 2015. PMID: 25767788 Free PMC article.
-
Seasonal fluctuations in weight and self-weighing behavior among adults in a behavioral weight loss intervention.Eat Weight Disord. 2020 Aug;25(4):921-928. doi: 10.1007/s40519-019-00707-7. Epub 2019 May 15. Eat Weight Disord. 2020. PMID: 31093925 Free PMC article.
References
-
- Hill JO, Wyatt HR, Reed GW, Peters JC. Obesity and the environment: where do we go from here? Science 2003;299:853–5 - PubMed
-
- Flegal KM, Troiano RP. Changes in the distribution of body mass index of adults and children in the US population. Int J Obes Relat Metab Disord 2000;24:807–18 - PubMed
-
- Ogden CL, Fryar CD, Carroll MD, Flegal KM. Mean body weight, height, and body mass index, United States 1960-2002. Adv Data 2004;347:1–17 - PubMed
-
- Wang Y, Beydoun MA, Liang L, Caballero B, Kumanyika SK. Will all Americans become overweight or obese? Estimating the progression and cost of the US obesity epidemic. Obesity (Silver Spring) 2008;16:2323–30 - PubMed
Publication types
MeSH terms
LinkOut - more resources
Full Text Sources
