. 2012 Mar;8(3):401-12.
doi: 10.4161/auto.18777. Epub 2012 Feb 3.

A high-throughput FRET-based assay for determination of Atg4 activity

Affiliations

A high-throughput FRET-based assay for determination of Atg4 activity

Min Li et al. Autophagy. 2012 Mar.

Abstract

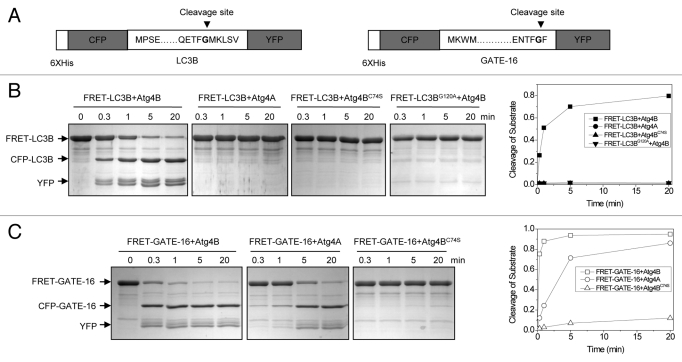
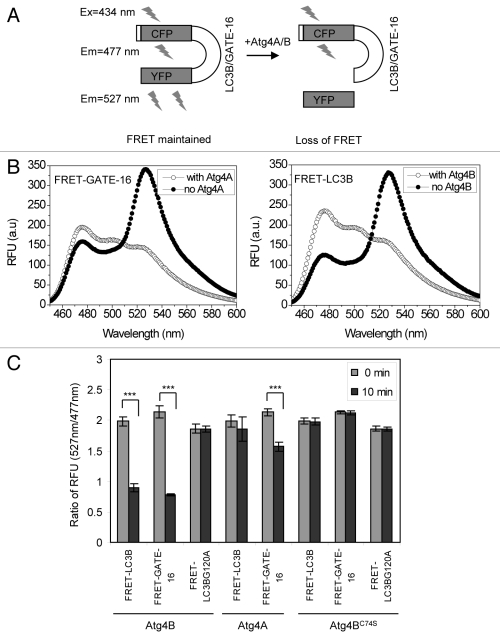
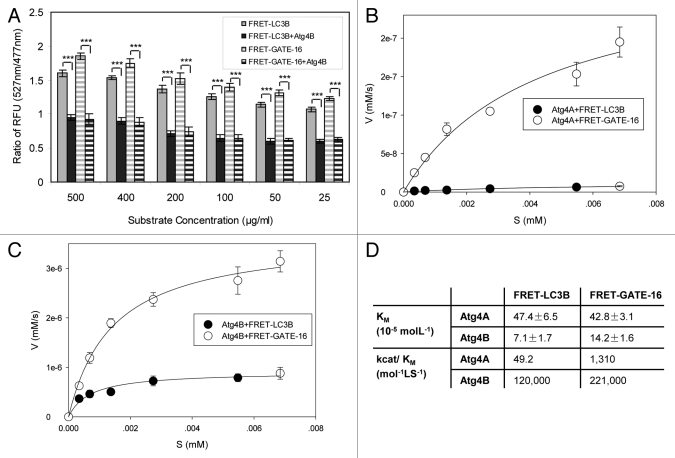
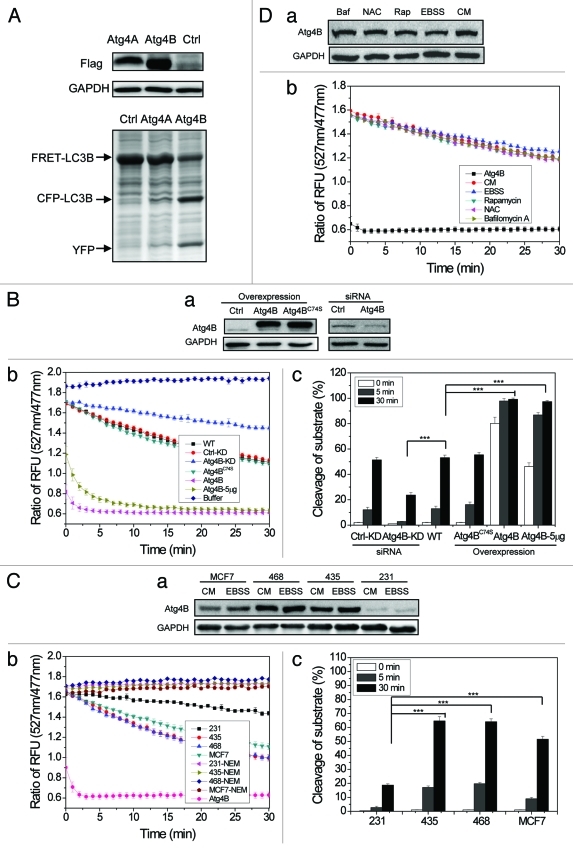
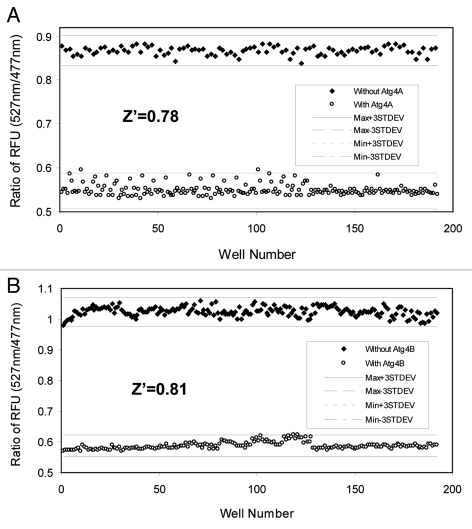
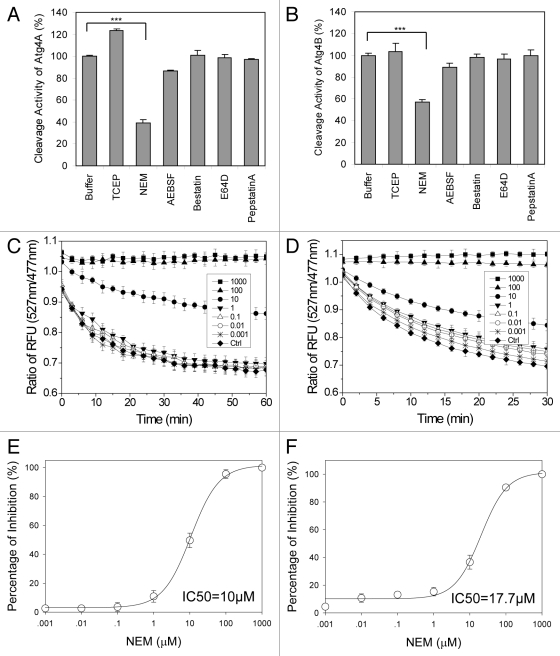
Atg4 is required for cleaving Atg8, allowing it to be conjugated to phosphatidylethanolamine on phagophore membranes, a key step in autophagosome biogenesis. Deconjugation of Atg8 from autophagosomal membranes could be also a regulatory step in controlling autophagy. Therefore, the activity of Atg4 is important for autophagy and could be a target for therapeutic intervention. In this study, a sensitive and specific method to measure the activity of two Atg4 homologs in mammalian cells, Atg4A and Atg4B, was developed using a fluorescence resonance energy transfer (FRET)-based approach. Thus LC3B and GATE-16, two substrates that could be differentially cleaved by Atg4A and Atg4B, were fused with CFP and YFP at the N- and C-terminus, respectively, allowing FRET to occur. The FRET signals decreased in proportion to the Atg4-mediated cleavage, which separated the two fluorescent proteins. This method is highly efficient for measuring the enzymatic activity and kinetics of Atg4A and Atg4B under in vitro conditions. Applications of the assay indicated that the activity of Atg4B was dependent on its catalytic cysteine and expression level, but showed little changes under several common autophagy conditions. In addition, the assays displayed excellent performance in high throughput format and are suitable for screening and analysis of potential modulators. In summary, the FRET-based assay is simple and easy to use, is sensitive and specific, and is suitable for both routine measurement of Atg4 activity and high-throughput screening.


Figures

None
Figure 1. Verification of the cleavage of FRET substrates by Atg4 using SDS-PAGE. (A) Schematic representation of the FRET-LC3B and FRET-GATE-16 constructs. The cleavage site of LC3B and GATE-16 at the glycine (G) residue is indicated. (B and C) FRET-LC3B, FRET-LC3BG120A (B) or FRET-GATE-16 (C) (5 µg) were incubated with Atg4B, Atg4BC74S or Atg4A (0.25 µg), respectively. The reaction was stopped at different times using SDS-PAGE sample buffer. The substrates and the cleaved products were separated by SDS-PAGE and examined by CBB staining. Representative gel images from three independent experiments are shown in the left panels. Percentage of cleaved substrate was calculated based on the densitometry of protein bands of the representative experiments (right panels).
None
Figure 2. Verification of the cleavage of FRET substrate by Atg4 using the FRET-based assay. (A) Schematic representation of the assay principle. The FRET signal (λem = 527 nm) is reduced as the result of cleavage, which separates the CFP (donor) moiety from the YFP (acceptor) moiety. (B) The fluorescence emission spectra of FRET-GATE-16 or FRET-LC3B before and after cleavage. Substrate (500 μg/ml) were mixed with buffer, Atg4A (100 μg/ml) or Atg4B (2 μg/ml) in a cuvette in the volume of 0.5 ml for 30 min. Data from representative experiments were collected on a Cary Eclipse spectrophotometer. The excitation wavelength was 434 nm. Emission peaked at 477 nm with Atg4 present, but at 527 nm with no Atg4 present in the reactions. In the presence of the corresponding Atg4 enzyme, the ratio of 527 nm/477 nm for FRET-GATE-16 decreased from 1.8 to 0.6 and that for FRET-LC3B was reduced from 1.65 to 0.69. (C) FRET-LC3B, FRET-GATE-16 and FRET-LC3BG120A (100 μg/ml) were incubated with Atg4A, Atg4B, or Atg4BC74S (2 μg/ml) in a volume of 200 μl for 10 min. The fluorescence ratios of 527 nm/477 nm at the beginning and at the 10 min point were determined. Data represent the mean ± SD from three independent experiments. ***p < 0.001 (paired t-test, panel C).
None
Figure 3. Determination of the kinetics of Atg4A and Atg4B using the FRET-based assay. (A–C) FRET-LC3B and FRET-GATE-16 at different concentrations (25 μg/ml to 500 μg/ml) were incubated with Atg4B (2 μg/ml in A, 0.5 μg/ml in B) or Atg4A (2.5 μg/ml, C) for 30 min at 37°C. The RFUs at 527 nm and 477 nm were determined and the ratios were calculated (A). The initial velocity (V, y-axis) at each substrate concentration was defined as the increment of the substrate per second ([mM]/s), and was calculated based on RFU at the 5 min time point of the reaction for Atg4B (B) or at the 30 min time point of the reaction for Atg4A (C) The velocity was then plotted against the concentration of the substrate (S [mM], x-axis). The curves were fitted using the ligand-binding method (SigmaPlot 10.0). (D). The kinetic parameters KM and kcat/KM were derived from the fitted curves. Data represent the mean ± SD from three independent experiments. ***p < 0.001 (paired t-test, A).
None
Figure 4. Measurements of Atg4B activity in cell lysates using the FRET-based assay. (A) HEK-293A cells were transfected with Flag-Atg4A, Flag-Atg4B or vector for 24 h. Cells were harvested and cell lysates (25 μg) were mixed with FRET-LC3B (5 µg) for 20 min before the reaction was stopped by the addition of sample loading buffer, and separated by SDS-PAGE. The expression level of Flag-Atg4A and Flag-Atg4B was detected by immunoblot assay using an anti-Flag antibody. The cleavage was assessed after CBB staining. (B) HEK-293A cells were transfected with Flag-Atg4B, Flag-Atg4BC74S or the control vectors. Alternatively, they were transfected with a control siRNA or a siRNA against Atg4B. Cell lysates (20 μg) were prepared and subjected to immunoblot analysis (a), or incubated with FRET-LC3B (3 µg) for the cleavage assay (b). Five micrograms (indicated) or 20 µg (all others) of lysates were used. WT, control; KD, control or Atg4B siRNA-treated. The percentage of substrate cleavage (c) was calculated. (C) Four breast cancer cell lines were cultured in complete medium (CM) or EBSS for 4 h. Cell lysates (20 μg) were prepared and subjected to immunoblot analysis (a), or incubated with FRET-LC3B for the cleavage assay (b). A positive control group with purified recombinant Atg4B (2 μg) was included. A generic cysteine protease inhibitor, NEM (100 µM), was included in some reactions as indicated. The percentage of substrate cleavage (c) was calculated. (D) HEK-293A cells were incubated in EBSS, or in complete medium alone (CM) or with rapamycin (Rap, 2 µM), N-acetylcysteine (NAC, 20 mM) or bafilomycin A1 (Baf, 1 µM) for 4 h. Cell lysates were prepared and subjected to immunoblot analysis (a), or incubated with FRET-LC3B for the cleavage assay (b). A positive control group with purified recombinant Atg4B (2 μg) was included (indicated as Atg4B). Data represent the mean ± SD from three independent experiments. ***p < 0.001 (one way ANOVA, B, c; and C, c).
None
Figure 5. Determination of the performance of the FRET-based Atg4 assay in a high-throughput format. Atg4A (10 μg/ml, A) or Atg4B (2 µg/ml, B) were mixed with 60 μg/ml of FRET-GATE-16 (A) or FRET-LC3B (B) in a total volume of 20 µl in 384-well plates. After 60 min incubation, the RFU ratio of 527 nm/477 nm was determined for each of the reactions in 192 wells (solid circle). Control reactions with no Atg4 enzymes were set up in the same way (open circle). The ranges of the maximal and minimal values ± three standard deviations were indicated and the Z’ factors for both Atg4A and Atg4B assays were calculated.
None
Figure 6. Assessment of selected protease inhibitors on Atg4 using the FRET-based assay. (A and B) Atg4A (10 µg/ml, A) or Atg4B (2 µg/ml, B) were incubated with the indicated compounds (10 μM) for 30 min at 37°C in a 384-well plate. The FRET signal was recorded after adding FRET-GATE-16 (A) or FRET-LC3B (B) (50 μg/ml) to a total volume of 50 µl. The RFU ratios of 527 nm/477 nm at the reaction time of 60 min (A) or 30 min (B) were determined. The relative Atg4 cleavage activity was expressed using the ratios normalized to that of the control (buffer only). (C and D) Atg4A (10 μg/ml, C) or Atg4B (2 µg/ml, D) were incubated with NEM at different concentrations (0–1,000 μM) for 30 min at 37°C in a 384-well plate. FRET-LC3B (50 μg/ml) was then added and the fluorescence signals at 477 nm and 527 nm were measured consecutively in the next 60 min (C) or 30 min (D) and the ratios of 527 nm/477 nm were determined. (E and F) The percentages of inhibition on the activity of Atg4A (E) or Atg4B (F) in the presence of different concentrations of NEM at the time when maximal cleavage was achieved (60 min for Atg4A, E, 30 min for Atg4B, F) were calculated. The IC50 was then determined for each enzyme-compound combination. Data represent the mean ± SD from three independent experiments. ***p < 0.001 (one way ANOVA, A and B).

References

    1. Shintani T, Klionsky DJ. Autophagy in health and disease: a double-edged sword. Science. 2004;306:990–5. doi: 10.1126/science.1099993. - DOI - PMC - PubMed
    1. Mizushima N, Levine B, Cuervo AM, Klionsky DJ. Autophagy fights disease through cellular self-digestion. Nature. 2008;451:1069–75. doi: 10.1038/nature06639. - DOI - PMC - PubMed
    1. Lum JJ, DeBerardinis RJ, Thompson CB. Autophagy in metazoans: cell survival in the land of plenty. Nat Rev Mol Cell Biol. 2005;6:439–48. doi: 10.1038/nrm1660. - DOI - PubMed
    1. Komatsu M, Kominami E, Tanaka K. Autophagy and neurodegeneration. Autophagy. 2006;2:315–7. - PubMed
    1. Jin S, White E. Role of autophagy in cancer: management of metabolic stress. Autophagy. 2007;3:28–31. - PMC - PubMed

Publication types

MeSH terms

LinkOut - more resources