. 2012 Mar;8(3):297-309.
doi: 10.4161/auto.18658. Epub 2012 Feb 3.

Enhancing lysosome biogenesis attenuates BNIP3-induced cardiomyocyte death

Affiliations

Enhancing lysosome biogenesis attenuates BNIP3-induced cardiomyocyte death

Xiucui Ma et al. Autophagy. 2012 Mar.

Abstract

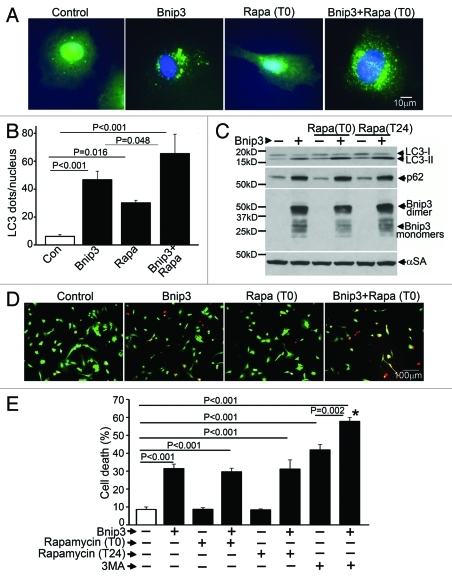
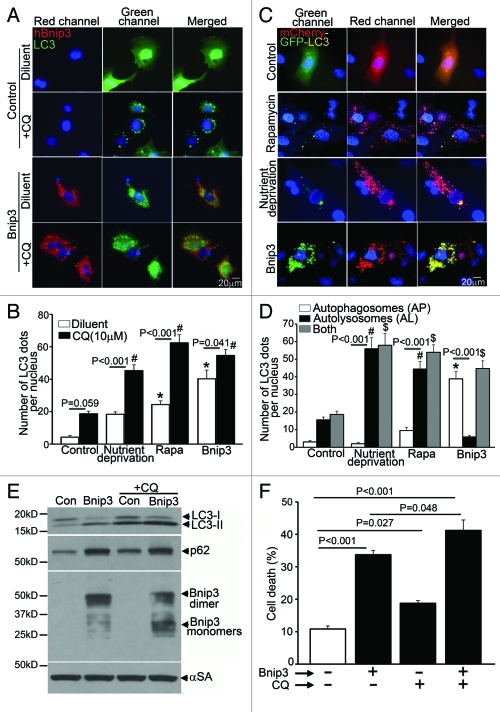
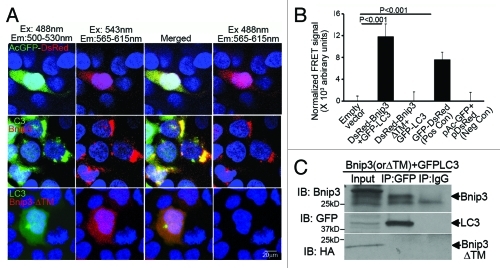
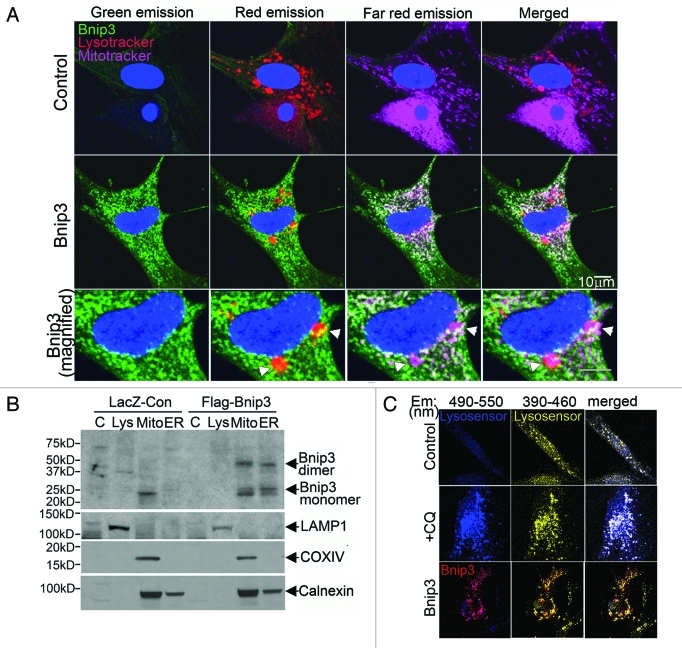
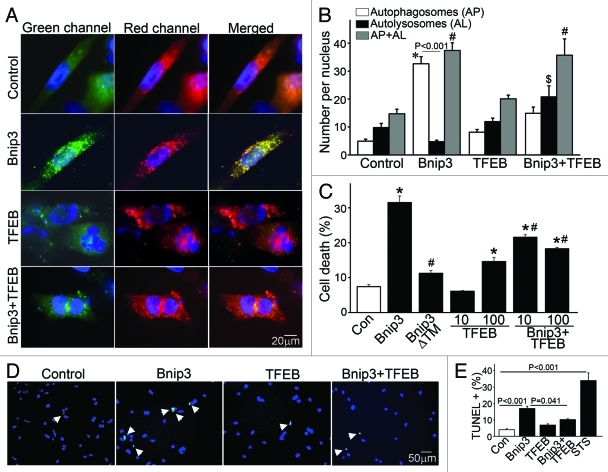
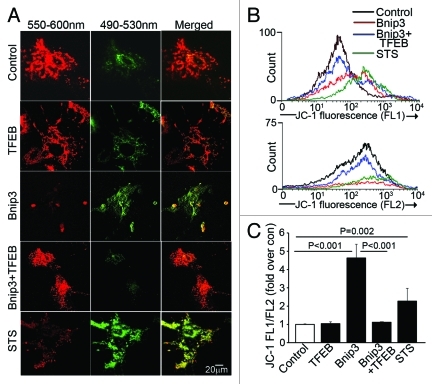
Hypoxia-inducible pro-death protein BNIP3 (BCL-2/adenovirus E1B 19-kDa interacting protein 3), provokes mitochondrial permeabilization causing cardiomyocyte death in ischemia-reperfusion injury. Inhibition of autophagy accelerates BNIP3-induced cell death, by preventing removal of damaged mitochondria. We tested the hypothesis that stimulating autophagy will attenuate BNIP3-induced cardiomyocyte death. Neonatal rat cardiac myocytes (NRCMs) were adenovirally transduced with BNIP3 (or LacZ as control; at multiplicity of infection = 100); and autophagy was stimulated with rapamycin (100 nM). Cell death was assessed at 48 h. BNIP3 expression increased autophagosome abundance 8-fold and caused a 3.6-fold increase in cardiomyocyte death as compared with control. Rapamycin treatment of BNIP3-expressing cells led to further increase in autophagosome number without affecting cell death. BNIP3 expression led to accumulation of autophagosome-bound LC3-II and p62, and an increase in autophagosomes, but not autolysosomes (assessed with dual fluorescent mCherry-GFP-LC3 expression). BNIP3, but not the transmembrane deletion variant, interacted with LC3 and colocalized with mitochondria and lysosomes. However, BNIP3 did not target to lysosomes by subcellular fractionation, provoke lysosome permeabilization or alter lysosome pH. Rather, BNIP3-induced autophagy caused a decline in lysosome numbers with decreased expression of the lysosomal protein LAMP-1, indicating lysosome consumption and consequent autophagosome accumulation. Forced expression of transcription factor EB (TFEB) in BNIP3-expressing cells increased lysosome numbers, decreased autophagosomes and increased autolysosomes, prevented p62 accumulation, removed depolarized mitochondria and attenuated BNIP3-induced death. We conclude that BNIP3 expression induced autophagosome accumulation with lysosome consumption in cardiomyocytes. Forced expression of TFEB, a lysosomal biogenesis factor, restored autophagosome processing and attenuated BNIP3-induced cell death.


Figures

None
Figure 1. Rapamycin treatment does not protect against BNIP3-induced cell death. (A) Representative epifluorescence images (630× magnification) demonstrating cellular localization of GFP-LC3 in NRCMs adenovirally transduced with BNIP3 or LacZ (as control) for 48 h, and treated with rapamycin (100 nmol/L) at T (time) = 0 (simultaneously at transduction). Nuclei are blue (DAPI). (B) Quantitation of punctate GFP-LC3 dots in cells from (A) (n = 25–40 nuclei/group). p values are by post-hoc test. (C) Immunoblot demonstrating LC3, p62 and BNIP3 (FLAG) expression in NRCMs adenovirally transduced with BNIP3 or LacZ (Con) for 48 h, and treated with rapamycin (100 nmol/L) at T (time) = 0 or 24 h after transduction. Expression of α-sarcomeric actin (αSA) was assessed as loading control. (D) Representative images (200× magnification) demonstrating live (green) and dead (red) cells treated as in (A). (E) Cell death in NRCMs adenovirally transduced with BNIP3 or LacZ (as control) for 48 h, and treated with rapamycin (100 nmol/L) at T(time) = 0 or 24 h after transduction; or 3 methyl-adenine (7 mmol/L) at t = 24 h. n = 8/group. *p < 0.001 vs Bnip3-expressing cells. All p values are by post-hoc test.
None
Figure 2. BNIP3 induces autophagosome accumulation in NRCMs. (A) Representative epifluorescence images (630× magnification) demonstrating cellular localization of GFP-LC3 in NRCMs adenovirally transduced with BNIP3 (Red; for FLAG) or LacZ (as control) for 48 h, and treated with chloroquine (10 μM, black bars) or diluent (white bars) for 24 h prior to fixation. Nuclei are blue (DAPI). (B) Quantification of punctate GFP-LC3 dots in cells treated as in (A). and in cells subjected to nutrient deprivation or treated with rapamycin (100 nM) for 4 h in the presence of chloroquine (10 μM, black bars) or diluent (white bars). p values are by post-hoc test. *p < 0.05 vs. diluent-treated control group. #p < 0.05 vs. CQ-treated control group (n = 15–25 nuclei/group). (C) Representative epifluorescence images (630× magnification) demonstrating cellular localization of mCherry-GFP-LC3 in NRCMs adenovirally transduced with Bnip3 or LacZ (as control) for 48 h; subjected to nutrient deprivation or treated with rapamycin (100 nM) for 4 h. (D) Quantitation of autophagosomes (green+red; white bars), autolysosomes (red, black bars) and both (gray bars) in NRCMs treated as in (C) (n = 20–40 nuclei/group). p values are by post-hoc test. *p < 0.05 for autophagosomes vs. control; #p < 0.05 for autolysosomes vs. control and $p < 0.05 for both vs. control (n = 15–25 nuclei/group). (E) Immunoblot demonstrating LC3, p62 and BNIP3 (FLAG) expression in NRCMs adenovirally transduced with BNIP3 or LacZ (Con) for 48 h and treated with chloroquine (10 μmol/L) or diluent for 24 h. Expression of α-sarcomeric actin (αSA) was assessed as loading control. (F) Cell death in NRCMs treated as in E (n = 8–24/group).
<b>Figure 3</b>.
Figure 3.
The transmembrane domain of BNIP3 is required for its interaction with LC3 to target mitochondria into autophagosomes. (A) Representative confocal images (630X) demonstrating FRET interaction between BNIP3, BNIP3ΔTM (both tagged with DsRed monomer) and LC3 (tagged with GFP) in HEK293 cells. Cells transfected with DsRed-GFP dual fluorescent construct are shown as positive control. Nuclei are blue (Hoechst dye). Images with acquired at the excitation (Ex) and emission (Em) settings indicated and merged as shown. (B) Quantitation of FRET signal in cells treated as in (A) (n = 8/group). Cells transfected with constructs expressing DsRed-monomer and GFP, separately, are shown as negative control. p values are by post-hoc test. (C) 3T3 fibroblasts were co-transduced with adenoviruses coding for FLAG-BNIP3, or HA-BNIP3ΔTM and GFP-LC3 (100 MOI each for 48 h) and extracts subjected to co-immunoprecipitation employing BNIP3, GFP and IgG control antibodies.
None
Figure 4. BNIP3 does not target to lysosomes or affect lysosomal acidification. (A) Representative confocal images (630×) of NRCMs adenovirally transfected with LacZ (Control, top panel) or BNIP3 (green, middle panel, zoomed-in view in bottom panel), costained for lysosomes (red; LysoTracker red) and mitochondria (pink, MitoTracker deep red), demonstrating colocalization of BNIP3 with mitochondria and lysosomes (white arrowheads). (B) HL-1 cardiac myocytes were adenovirally transduced with LacZ (Control) or FLAG-Bnip3 for 48 h and subcellular fractionation performed to obtain fractions enriched for lysosomes (Lys), mitochondria (mito), endoplasmic reticulum (ER) and cytoplasm (C). Representative immunoblot demonstrating distribution of BNIP3 (FLAG) in fractions enriched for LAMP1 (lysosome marker), COXIV (mitochondrial marker) and calnexin (ER marker). (C) Representative confocal images (630×) of NRCMs adenovirally transduced with LacZ (Control) and BNIP3 (red) for 48 h and stained with lysosensor yellow/blue to assess acidification status of lysosomes. Images were obtained at excitation with 360 nm and emission split between 390–460 nm (blue, corresponding to emission maxima at pH 9.0) and 490–550 nm (yellow, corresponding to emission maxima at pH 3.0). NRCMs treated with chloroquine (10 µmol/L for 1 h) to inhibit lysosomal acidification are shown as controls.
<b>Figure 5</b>.
Figure 5.
BNIP3-induced autophagy is associated with reduced lysosome abundance, which is restored by co-expression of TFEB. (A) Representative epiflourescence images (630X) demonstrating lysosome distribution (by LysoTracker red staining) in cells adenovirally transduced with Bnip3, TFEB (green, at 100 MOI), BNIP3+TFEB (at 100 MOI each) for 48 h. Nuclei are blue (Hoechst dye). Adenovirus coding for LacZ expression was added as necessary to result in equivalent MOIs (at total 200 MOI per treatment). (B) Flow cytometric analysis of LysoTracker red staining in cells treated as in (A). Control is depicted in black, BNIP3 in green, TFEB in red and BNIP3+TFEB in blue. (C) Assessment of LysotTracker red expression by flow cytometry in NRCMs expressing BNIP3, BNIP3 ΔTM, TFEB, BNIP+TFEB for 48 h; and in BNIP3 expressing cells treated for 24 h with 3MA (7 mmol/L). (D) Representative immunoblots demonstrating LC3, p62, BNIP3 (FLAG), BNIP3ΔTM (HA), TFEB (both rat TFEB and HA tagged human TFEB) and LAMP1 expression, with α-sarcomeric actin (αSA) in NRCMs adenovirally transduced with LacZ (control), BNIP3, BNIP3ΔTM, TFEB and BNIP3+TFEB as in (A) (for 48 h). (E–H) Quantitative assessment of LC3-II/α-sarcomeric actin ratio (E), total LC3 (F), p62 (G) and LAMP1 (H) abundance in NRCMs treated as in D (n = 3–7/group). p values are by post-hoc test.
None
Figure 6. Forced expression of TFEB restores autophagosome processing and attenuates cell death in BNIP3-expressing NRCMs. (A) Representative epifluorescence images (630× magnification) demonstrating cellular localization of mCherry-GFP-LC3 in NRCMs adenovirally transduced with LacZ (as control), BNIP3, TFEB and BNIP3+TFEB for 48 h. Nuclei are blue (DAPI). Adenovirus coding for LacZ expression was added as necessary to result in equivalent MOIs (at total 200 MOI per treatment). (B) Quantitation of autophagosomes (green+red; white bars), autolysosomes (red, black bars) and both (gray bars) LC3 in NRCMs treated as in (A) (n = 25–40 nuclei/group). *p < 0.05 vs. autophagosomes, $p < 0.05 vs autolysosomes and #p < 0.05 vs. both in control group by post-hoc test. (C) Assessment of cell death in NRCMs transduced with LacZ (control), BNIP3, BNIP3ΔTM, TFEB (at MOIs = 10 and 100) and BNIP3+TFEB (at MOIs = 10 and 100) for 48 h. Adenovirus coding for LacZ expression was added as necessary to result in equivalent MOIs (at total 200 MOI per treatment). *p < 0.05 vs. control and #p < 0.05 vs. BNIP3 by post-hoc test. (D) Representative epifluorescence images (200× magnification) demonstrating TUNEL staining (green) in NRCMs treated as in (A). Nuclei are blue (DAPI). (E) Quantitative assessment of TUNEL positivity in NRCMs treated as in (A). Adenovirus coding for LacZ expression was added as necessary to result in equivalent MOIs (at total 200 MOI per treatment) for both (D and E). Treatment with staurosporine (1 μmol/L for 24 h) was employed as positive control (n = 5–9 experiments/group). p values are by post-hoc test.
None
Figure 7. Forced expression of TFEB accelerates clearance of BNIP3-permeabilized mitochondria. (A) Representative confocal images of NRCMs adnovirally transduced with BNIP3, TFEB, BNIP3+TFEB (each at MOI = 100); and LacZ control (added to make total MOI = 200 in each group) for 48 h, demonstrating expression of JC-1 mitochondrial stain. Emission wavelengths employed for imaging the red and green fluorescence are depicted. Staurosporine (STS; 5 μmol/L for 2 h) was added as positive control. (B) Flow cytometric analysis of JC-1 expression with representative traces demonstrating green fluorescence (FL1 channel, B, top) and red fluorescence (FL2 channel, B, bottom). Control is depicted in black, BNIP3 in red, BNIP3+TFEB in blue and staurosporine in green. (C) Quantitation of ratio or FL1/FL2 fluorescence of JC-1 expression in NRCMs treated as in (A). p values depicted are by post-hoc test after one-way ANOVA (n = 3–6/group).

Similar articles

Cited by

References

    1. Whelan RS, Kaplinskiy V, Kitsis RN. Cell death in the pathogenesis of heart disease: mechanisms and significance. Annu Rev Physiol. 2010;72:19–44. doi: 10.1146/annurev.physiol.010908.163111. - DOI - PubMed
    1. Cory S, Adams JM. The Bcl2 family: regulators of the cellular life-or-death switch. Nat Rev Cancer. 2002;2:647–56. doi: 10.1038/nrc883. - DOI - PubMed
    1. Boyd JM, Malstrom S, Subramanian T, Venkatesh LK, Schaeper U, Elangovan B, et al. Adenovirus E1B 19 kDa and Bcl-2 proteins interact with a common set of cellular proteins. Cell. 1994;79:341–51. doi: 10.1016/0092-8674(94)90202-X. - DOI - PubMed
    1. Chen G, Ray R, Dubik D, Shi L, Cizeau J, Bleackley RC, et al. The E1B 19K/Bcl-2-binding protein Nip3 is a dimeric mitochondrial protein that activates apoptosis. J Exp Med. 1997;186:1975–83. doi: 10.1084/jem.186.12.1975. - DOI - PMC - PubMed
    1. Ray R, Chen G, Vande VC, Cizeau J, Park JH, Reed JC, et al. BNIP3 heterodimerizes with Bcl-2/Bcl-X(L) and induces cell death independent of a Bcl-2 homology 3 (BH3) domain at both mitochondrial and nonmitochondrial sites. J Biol Chem. 2000;275:1439–48. doi: 10.1074/jbc.275.2.1439. - DOI - PubMed

Publication types

MeSH terms