Comparative Study
. 2012 Feb 1;32(5):1545-59.
doi: 10.1523/JNEUROSCI.5123-11.2012.

Inflammatory effects of highly pathogenic H5N1 influenza virus infection in the CNS of mice

Affiliations
Comparative Study

Inflammatory effects of highly pathogenic H5N1 influenza virus infection in the CNS of mice

Haeman Jang et al. J Neurosci. .

Abstract

The A/VN/1203/04 strain of the H5N1 influenza virus is capable of infecting the CNS of mice and inducing a number of neurodegenerative pathologies. Here, we examined the effects of H5N1 on several pathological aspects affected in parkinsonism, including loss of the phenotype of dopaminergic neurons located in the substantia nigra pars compacta (SNpc), expression of monoamines and indolamines in brain, alterations in SNpc microglia number and morphology, and expression of cytokines, chemokines, and growth factors. We find that H5N1 induces a transient loss of the dopaminergic phenotype in SNpc and now report that this loss recovers by 90 d after infection. A similar pattern of loss and recovery was seen in monoamine levels of the basal ganglia. The inflammatory response in lung and different regions of the brain known to be targets of the H5N1 virus (brainstem, substantia nigra, striatum, and cortex) were examined at 3, 10, 21, 60, and 90 d after infection. In each of these brain regions, we found a significant increase in the number of activated microglia that lasted at least 90 d. We also quantified expression of IL-1α, IL-1β, IL-2, IL-6, IL-9, IL-10, IL-12(p70), IL-13, TNF-α, IFN-γ, granulocyte-macrophage colony-stimulating factor, granulocyte colony-stimulating factor, macrophage colony-stimulating factor, eotaxin, interferon-inducible protein 10, cytokine-induced neutrophil chemoattractant, monocyte chemotactic protein-1, macrophage inflammatory protein (MIP) 1α, MIP-1β, and VEGF, and found that the pattern and levels of expression are dependent on both brain region and time after infection. We conclude that H5N1 infection in mice induces a long-lasting inflammatory response in brain and may play a contributing factor in the development of pathologies in neurodegenerative disorders.


Figures
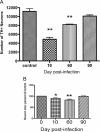
Figure 1.
Figure 1.
H5N1 infection alters TH+ neurons in SNpc. A, Following H5N1 infection, the number of TH+ dopaminergic neurons in the SNpc was reduced ∼60% at 10 d after infection and 20% at 60 d after infection from the noninfected control mice. At 90 d after infection, the number of TH+ dopaminergic neurons in the SNpc was similar to that of control mice. B, At day 10–60 after infection, dopaminergic neurons in the SNpc of H5N1-infected mice are shrunken compared with those of saline-administered mice. The longest length of TH+ neuronal cell bodies was reduced ∼20% at day 10 after infection. However, the size of these cells recovered and appeared similar to that seen in the control mice at 90 d after infection. Statistical significance was determined by one-way ANOVA followed by Student–Newman–Keuls post hoc tests (n = 5 for each time point, *p ≤ 0.05, **p ≤ 0.001 vs control mice). Error bars indicate SEM.
Figure 2.
Figure 2.
Percentage change in dopamine, DOPAC, and HVA in striatum and brainstem following systemic H5N1 infection. In striatum, the amount of dopamine was significantly decreased at day 10 after infection compared with control noninfected mice. By day 60 after infection, dopamine levels had recovered to baseline levels. This pattern of a transient decrease 10 d after infection followed by recovery by day 60 after infection was also seen in levels of HVA and DOPAC. In the brainstem, dopamine, DOPAC, and HVA levels sharply increased at 10 d after infection, and then returned to their basal levels by day 60 after infection. Statistical significance was determined by one-way ANOVA followed by Student–Newman–Keuls post hoc tests (n = 5 for each condition, *p ≤ 0.05, **p ≤ 0.001 vs control mice). Error bars indicate SEM.
Figure 3.
Figure 3.
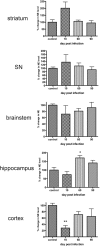
Percentage change in the amount of NE in brain following H5N1 infection. No significant changes were seen in NE levels in striatum, substantia nigra, or brainstem. In hippocampus, NE levels significantly increased at day 60 after infection, and returned to basal levels at 90 d after infection. The cortex showed a significant loss of NE at 10 d after infection, which returned to baseline by 60 d after infection. Statistical significance was determined by one-way ANOVA followed by Student–Newman–Keuls post hoc tests (n = 5 for each condition, *p ≤ 0.05, **p ≤ 0.001 compared with control mice). Error bars indicate SEM.
Figure 4.
Figure 4.
Percentage change in 5-HT and 5-HIAA in brain following H5N1 infection. The level of 5-HT was significantly reduced in the striatum, substantia nigra, and cortex starting at day 10 after infection and remained reduced through day 90 after infection. A similar reduction pattern was seen in the level of 5-HIAA, although there was a return to baseline levels in the substantia nigra. Although the mean levels of 5-HT and 5-HIAA in hippocampus and brainstem trended lower, none of these changes achieved statistical significance. Statistical significance was determined by one-way ANOVA followed by Student–Newman–Keuls post hoc tests (*p ≤ 0.05, **p ≤ 0.001 vs control mice). Error bars indicate SEM.
Figure 5.
Figure 5.
H5N1 infection increases the number of activated microglia in the SNpc. A, B, Photomicrographs showing the typical appearance of resting (A) and activated microglia (B). Both resting and activated microglia were observed in the substantia nigra of noninfected control and H5N1-infected mice. C, The number of activated microglia increased approximately threefold in the H5N1-infected group, compared with the control group. The number of microglia also increased ∼67% in the H5N1-infected group, compared with the control group. Statistical significance was determined by one-way ANOVA followed by Student–Newman–Keuls post hoc tests (n = 4 for each group, **p < 0.001 vs control mice). Error bars indicate SEM.
Figure 6.
Figure 6.
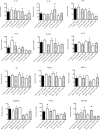
Patterns of cytokine, chemokine, and growth factor expression observed following H5N1 infection. The following four distinct temporal patterns were observed in the expression of cytokines, chemokines, and growth factors along the time course after H5N1 infection: Pattern 1, a transient increase at initial phase of infection followed by a return to basal levels; Pattern 2, an initial transient decrease in expression followed by a return to baseline levels; Pattern 3, an initial transient increase in expression followed by a return to baseline levels and then a reinduction at day 60 after infection (dpi); and Pattern 4, no changes during the active phase of infection, but induction after day 60 after infection.
Figure 7.
Figure 7.
Expression of cytokines, chemokines, and growth factors in the lung following intranasal H5N1 infection. Two distinct patterns were observed in the lung. The proinflammatory cytokines, chemokines, and growth factors IL-6, IL-12, G-CSF, GM-CSF, IFN-γ, KC, MIP-1α, MIP-1β, and TNF-α, and anti-inflammatory IL-10 increased during the initial phase of infection (through day 10 after infection) and then returned to baseline levels (Pattern 1). The proinflammatory cytokine IL-2 showed an initial decrease in expression at 10 d after infection followed by a return to baseline levels (Pattern 2). The growth factor VEGF showed an initial transient increase followed by a decrease below the baseline levels and then reinduction at 60 d after infection (Pattern 3). Statistical significance was determined by one-way ANOVA followed by Student–Newman–Keuls test. Cytokine levels (picograms per milliliter) are presented as mean ± SEM (n = 4 for each group and time point, *p ≤ 0.05, **p ≤ 0.001 vs control baseline).
Figure 8.
Figure 8.
Expression of cytokines, chemokines, and growth factors in the brainstem following intranasal H5N1 infection. Three distinct patterns were observed in the brainstem. The proinflammatory cytokines, chemokines, and growth factors IL-1α, IL-12(p70), IL-13, eotaxin, G-CSF, GM-CSF, IP-10, KC, M-CSF, MCP-1, MIP-1α, MIP-1β, and TNF-α, and anti-inflammatory IL-10 increased during the initial phase of infection (through day 10 after infection) and then returned or decreased to baseline levels (Pattern 1). The proinflammatory cytokines IL-2 and IL-9 showed an increase, return to baseline, and re-expression (Pattern 3), while the proinflammatory cytokines, chemokines, and growth factors, including IL-1β, IL-2, and VEGF, did not show changes during the active phase of infection, but later displayed induction (Pattern 4). Statistical significance was determined by one-way ANOVA followed by Student–Newman–Keuls test, and cytokine levels (picograms per milliliter) are presented as mean ± SEM (n = 4 for each group and time point, *p ≤ 0.05, **p ≤ 0.001 vs baseline control).
Figure 9.
Figure 9.
Expression of cytokines, chemokines, and growth factors in the substantia nigra following intranasal H5N1 infection. In substantia nigra, the proinflammatory cytokines/chemokines IL-1β, IL-2, IL-6, G-CSF, M-CSF, and MCP-1 increased during the initial phase of infection (through day 10 after infection) and then returned or decreased to baseline levels (Pattern 1). The proinflammatory cytokine IL-13 initially increased and then returned to baseline levels before reinduction at 60 d after infection (Pattern 3). The proinflammatory chemokine MIP-1β and growth factor GM-CSF did not show changes during the active phase of infection (through day 10 after infection), but later displayed induction (Pattern 4). Statistical significance was determined by one-way ANOVA followed by Student–Newman–Keuls test, and cytokine levels (picograms per milliliter) are presented as mean ± SEM (n = 4 for each group and time point, *p ≤ 0.05,**p ≤ 0.001 vs baseline control).
Figure 10.
Figure 10.
Expression of cytokines, chemokines, and growth factors in the striatum following intranasal H5N1 infection. In striatum, the proinflammatory chemokines and growth factors eotaxin and M-CSF increased during the initial phase of infection (through day 10 after infection) and then returned to baseline levels (Pattern 1). The proinflammatory cytokine IL-2 initially increased and then returned to baseline levels, after which it reinduced at 60 d after infection (Pattern 3). The anti-inflammatory cytokine IL-10 did not show changes during the active phase of infection, but later displayed induction (Pattern 4). Statistical significance was determined by one-way ANOVA followed by Student–Newman–Keuls test, and cytokine levels (picograms per milliliter) are presented as mean ± SEM (n = 4 for each group and time point, *p ≤ 0.05,**p ≤ 0.001 vs baseline control).
Figure 11.
Figure 11.
Expression of cytokines, chemokines, and growth factors in the cerebral cortex following intranasal H5N1 infection. In cortex, the proinflammatory cytokines, chemokines, and growth factors IL-β, IL-9, eotaxin, IP-10, KC, M-CSF, and MCP-1 increased during the initial phase of infection (through day 10 after infection) and then returned or decreased to baseline levels (Pattern 1). The proinflammatory cytokine IL-2 and anti-inflammatory IL-10 initially increased, returned to baseline levels, and then reinduced at 60 d after infection (Pattern 3). The proinflammatory growth factor VEGF did not show changes during the active phase of infection, but later displayed induction (Pattern 4). IL-1α, IL-6, IL-12, IL-13, G-CSF, GM-CSF, IFN-γ, MIP-1α, MIP-1β, and TNF-α were not detected in cortex following exposure to influenza. Statistical significance was determined by one-way ANOVA followed by Student–Newman–Keuls test, and cytokine levels (picograms per milliliter) are presented as mean ± SEM (n = 4 for each group and time point, *p ≤ 0.05, **p ≤ 0.001 vs baseline control).
Figure 12.
Figure 12.
Expression of cytokines, chemokines, and growth factors at 8, 24, and 48 h following addition of dopamine to primary substantia nigra cultures. In primary substantia nigra cultures, addition of 5 μm dopamine results in a significant increase in IL-1β; addition of 500 nm dopamine results in a significant increase in TNF-α and IL-13. Statistical significance was determined by one-way ANOVA followed by Student–Newman–Keuls test, and are presented as mean ± SEM (n = 4 for each group and time point, *p < 0.05, vs baseline control).

References

    1. Appel SH, Beers DR, Henkel JS. T cell-microglial dialogue in Parkinson's disease and amyotrophic lateral sclerosis: are we listening? Trends Immunol. 2010;31:7–17. - PMC - PubMed
    1. Baquet ZC, Williams D, Brody J, Smeyne RJ. A comparison of model-based (2D) and design-based (3D) stereological methods for estimating cell number in the substantia nigra pars compacta (SNpc) of the C57BL/6J Mouse. Neuroscience. 2009;161:1082–1090. - PMC - PubMed
    1. Bazzu G, Calia G, Puggioni G, Spissu Y, Rocchitta G, Debetto P, Grigoletto J, Zusso M, Migheli R, Serra PA, Desole MS, Miele E. alpha-Synuclein- and MPTP-generated rodent models of Parkinson's disease and the study of extracellular striatal dopamine dynamics: a microdialysis approach. CNS Neurol Disord Drug Targets. 2010;9:482–490. - PubMed
    1. Boyd JD, Jang H, Shepherd KR, Faherty C, Slack S, Jiao Y, Smeyne RJ. Response to 1-methyl-4-phenyl-1,2,3,6-tetrahydropyridine (MPTP) differs in mouse strains and reveals a divergence in JNK signaling and COX-2 induction before loss of neurons in the substantia nigra pars compacta. Brain Res. 2007;1175:107–116. - PMC - PubMed
    1. Carr MW, Roth SJ, Luther E, Rose SS, Springer TA. Monocyte chemoattractant protein 1 acts as a T-lymphocyte chemoattractant. Proc Natl Acad Sci U S A. 1994;91:3652–3656. - PMC - PubMed

Publication types

MeSH terms

Substances