Comparative Study
. 2012 Feb 1;32(5):1589-601.
doi: 10.1523/JNEUROSCI.4748-11.2012.

Changing microcircuits in the subplate of the developing cortex

Affiliations
Comparative Study

Changing microcircuits in the subplate of the developing cortex

Sarada Viswanathan et al. J Neurosci. .

Abstract

Subplate neurons (SPNs) are a population of neurons in the mammalian cerebral cortex that exist predominantly in the prenatal and early postnatal period. Loss of SPNs prevents the functional maturation of the cerebral cortex. SPNs receive subcortical input from the thalamus and relay this information to the developing cortical plate and thereby can influence cortical activity in a feedforward manner. Little is known about potential feedback projections from the cortical plate to SPNs. Thus, we investigated the spatial distribution of intracortical synaptic inputs to SPNs in vitro in mouse auditory cortex by photostimulation. We find that SPNs fell into two broad classes based on their distinct spatial patterns of synaptic inputs. The first class of SPNs receives inputs from only deep cortical layers, while the second class of SPNs receives inputs from deep as well as superficial layers including layer 4. We find that superficial cortical inputs to SPNs emerge in the second postnatal week and that SPNs that receive superficial cortical input are located more superficially than those that do not. Our data thus suggest that distinct circuits are present in the subplate and that, while SPNs participate in an early feedforward circuit, they are also involved in a feedback circuit at older ages. Together, our results show that SPNs are tightly integrated into the developing thalamocortical and intracortical circuit. The feedback projections from the cortical plate might enable SPNs to amplify thalamic inputs to SPNs.


Figures

Figure 1.
Figure 1.
Subpopulations of SPNs have dendrites in the cortical plate. A, Colocalization of two markers of SPNs. Immunohistochemistry for complexin 3 (red) in CTGF-GFP animals (green). Blue stain is DAPI to highlight cell bodies. Note that CTGF cells are in the same lamina as Cplx3 cells but not all CTGF cells express complexin 3 (arrowheads indicate two CTGF+ cells, one that did and one that did not costain with complexin3). Scale bar, 50 μm. The majority of GFP+ cells (>80%; n = 98 cells, n = 13 fields) are located throughout the upper half of the subplate. B, CTGF cells are not GABAergic. Immunohistochemistry for GABA (red) in CTGF-GFP animals (green) shows that CTGF cells do not contain GABA. Scale bar, 50 μm. C, CTGF cells extend dendrites into the cortical plate. Shown are apical neurites from two CTGF-expressing SPNs (left and right pairs of panels). The neurites of both cells are studded with spines, suggesting that they are dendrites. The boxed region in the left panel of each pair is shown at higher magnification in the corresponding right panel. Scale bars (in each pair of panels): 5 and 1 μm, respectively.
Figure 2.
Figure 2.
Laser-scanning photostimulation reveals cortical inputs to SPNs. A, IR image of cortical field with patched SPN (pipette) that is being mapped. The box indicates the region of photostimulation. The borders between cortical layers based on IR image are indicated by white bars. The border between subplate and overlying layer 6 is characterized by a transition from horizontally oriented fibers and cells to a radial organization. The upper and lower subplates are indicated by “u” and “l.” B, LSPS performed at −70 and 0 mV holding potential reveals excitatory and inhibitory evoked currents, respectively. Stimulation close to the cell body at −70 mV reveals short-latency large-amplitude direct responses. The blue lines indicate the time of the laser pulse. The red line indicates the longer latency of evoked responses versus the short latency of direct responses. C, Left, Traces obtained by LSPS in 500 stimulus locations for one cell held at −70 mV. Traces showing a large-amplitude direct response are shown in gray. Note that large EPSCs can be observed at locations surrounding the direct response and at more superficial locations (highlighted in yellow box). Right, Traces obtained by LSPS in 500 stimulus locations for one cell held at 0 mV. Note that direct response is mostly absent. Note that large IPSCs can be observed at many locations. D, Maps of peak EPSC or IPSC transparently superimposed on the IR image of the slice. Colors indicate the amplitude. Locations resulting in a direct response are black. Note that EPCS and IPCS originate in locations surrounding the cell body, but also from more superficial locations including layers 2–4. E, F, Cell-attached recordings from layer 4 and layer 5/6 neurons. Plotted are maps of first spike latencies encoded in pseudocolor. Scale bar, 30 μm. Note that the shortest latencies are evoked close to the soma. Cumulative distribution on right show distance of stimulation locations where action potentials could be evoked for layer 4 (n = 7 at P4–P6 and n = 9 at P10–P14) and layer 5/6 cells (n = 8 at P4–P6 and n = 11 at P10–P14). Most effective locations were within 150 μm from soma in all cells (dashed black line). Note that, in layer 5/6, neurons stimulation at locations >400 μm from the soma were able to cause action potentials. These were locations in layer 2/3 and had long latencies (see cell on right in F). Note the paucity of effective location in layer 4. G, Cumulative distributions showing the latency of EPSCs and IPSCs evoked by layer 4 stimulation in SPNs (dashed lines) and showing the latency of action potentials in L4 neurons evoked by stimulation in L4 close to the soma (black line) and action potentials in L5/6 neurons at P10–P14 far from the soma [>200 μm, thus in layers 2/3–4 (see F); green line]. Latencies for evoking action potentials in layer 5/6 cells when stimulating at distal locations were significantly longer than latencies for PSCs in subplate with layer 4 stimulation (**p < 10−8).
Figure 3.
Figure 3.
A population of SPNs receives excitatory and inhibitory inputs from layers 2–4. A–C, Three examples of SPNs that show EPSCs and IPSCs evoked by stimulation of layer 2–4. A, Biocytin and IR pictures of recording location in the subplate. B, EPSC maps generated by holding the neuron at −70 mV and IPSC maps generated by holding the neuron at 0 mV. Maps are overlaid on the IR image of the cortex. Scale bar, 500 μm. C, Traces show summed EPSC (black) and IPSC (red), respectively, along the cortical (laminar) depth. Traces are normalized to the maximum and are aligned with the corresponding maps and images in B. Note that a large fraction of inputs originates in superficial layers. D, E, Three examples of SPNs that do not show EPSCs and IPSCs evoked by stimulation of layer 2–4. D, Biocytin and IR pictures of recording location in the subplate. E, EPSC maps generated by holding the neuron at −70 mV and IPSC maps generated by holding the neuron at 0 mV. Maps are overlaid on the IR image of the cortex. F, Traces show summed EPSC (black) and IPSC (red), respectively, along the cortical (laminar) depth. Traces are normalized to the maximum and are aligned with the corresponding maps and images in E. Note the absence of inputs originating in superficial layers. G, H, LSPS in CTGF-GFP mice to identify subplate location. G, DIC image of slice; region inside the box is shown in the higher-magnification fluorescence image to the right. Note that fluorescent cells are located more superficially than the recording electrode (arrowhead indicates electrode tip). Thus, the recorded cell was a SPN. H, Smoothed LSPS maps (see methods) of this cell, showing excitatory and inhibitory inputs from superficial cortical layers.
Figure 4.
Figure 4.
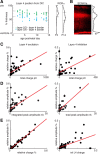
Cortical input from layer 4 to SPNs. A, Upper and lower borders of layer 4 for each mapped SPN determined from IR pictures. The locations are relative to the distance between ventricle (0%) and pia (100%). Note that the relative location of layer 4 shifts downward over development as layer 2/3 matures. The traces on the right indicate expression profiles of the layer 4 marker ROR-α (images from Allen Brain Atlas image series ID 100054927; images 101080073-7 and 100825083-7) in sagittal slices from mice at P4 and P14. Note that the peaks of the expression profiles approximately match the locations of layer 4 determined from DIC. B, Layer 4-specific RFP signal in thalamocortical slices of A1 at P11. RFP expression obtained by crossing the layer 4 driver line SCCN1a-Cre with flox-RFP. Expression profile on right shows peak that matches the locations of layer 4 determined from DIC. C, Total and relative integrated charge for EPSCs and IPSCs evoked by layer 4 stimulation. Total charge is calculated by summing the charges of each PSC at each stimulation site that gave rise to a PSC in layer 4. Relative charge is calculated by dividing by the total charge the cell receives from all layers. The red lines indicate linear regression (r2 = 0.39, r2 = 0.2 for left and right panels, respectively). D, Total and relative peak amplitude for EPSCs and IPSCs evoked by layer 4 stimulation. Total amplitude is calculated by summing the peak amplitudes of each PSC at each stimulation site that gave rise to a PSC in layer 4. Relative amplitude is calculated by dividing by the total amplitude the cell receives from all layers. The red lines indicate linear regression (r2 = 0.33, r2 = 0.54 for left and right panels, respectively). E, Relative integrated charge and amplitude for EPSCs and IPSCs evoked by layer 4 stimulation. The red lines indicate linear regression (r2 = 0.96, r2 = 0.4 for left and right panels, respectively).
Figure 5.
Figure 5.
Cortical input to SPNs develops in the second postnatal week. A, Histograms of relative amplitude (left) and charge of EPSCs (top) and IPSCs (bottom) originating from layer 4 stimulation in individual SPNs. The vertical dashed lines indicate intersection between the two distributions obtained with k-means clustering. B, Fraction of total variance explained by k-means clustering with different numbers of clusters. Graphs show clustering on relative EPSC charge and amplitude (top), relative IPSC charge and amplitude (middle), or on both EPSC and IPSC charge and amplitude (bottom). The horizontal dashed line indicates 70%. C, Histograms of integrated charge of layer 4 EPSCs and IPSCs in the different age groups. Note that, at young ages, only few cells had large inputs from layer 4. The vertical dashed line indicates where the whole population separates (see A). D, Age distribution of SPNs without (black; Group 1) or with (red; Group 2) layer 4 EPSC (top), IPSC (middle), or EPSC and IPSC (bottom) input. The solid lines show age distribution based on integrated charge, while the dashed lines show distribution based on peak amplitude. E, Left, Average LSPS map for SPNs within Group 1 at older ages (P10–P14). Cells were aligned to their soma position. Black indicates direct responses. Note that most inputs originate from close to the cell body and that the amplitudes of IPSCs are larger than those of EPSCs. Scale bar, 200 μm. Right, Average LSPS map for SPNs within Group 2 at older ages (P10–P14). Cells were aligned to their soma position. Black indicates direct responses. Note that large excitatory inputs originate from locations distal from the cell body in layer 4.
Figure 6.
Figure 6.
Columnar and laminar extent of inputs increases with age. A, EPSC and IPSC maps overlaid on the IR image of the cortex. Traces on the right side and bottom show summed EPSC (black) and IPSC (red) along the cortical (laminar) depth (right) and along the columnar extent (bottom). Traces are normalized to the respective maxima and aligned with the maps. Note the “dips” in the traces from the excitatory map indicating areas that showed direct responses (close to cell body, white dot), where no EPSC could be measured. Laminar or columnar widths are derived from measuring the 20% widths (dashed lines). B, Extent of excitation in the cortical plate (extent = laminar width − distance of cell body from layer 6 border; dashed lines in A) is correlated with the relative PSC amplitude from layer 4. Plotted are relative EPSC (left) and IPSC (right) amplitude from layer 4 versus excitatory (left) or inhibitory (right) laminar width for all SPNs (Group 1 indicated in black; Group 2 in red). The green lines indicate regression fits of the data. Note the significant correlation of relative layer 4 EPSC charge and excitatory laminar width (r2 = 0.49), and the weaker correlation of relative layer 4 IPSC charge and inhibitory laminar width (r2 = 0.004). C, The average excitatory of Group 2 SPNs (red; with layer 4 inputs) is larger than the extent for Group 1 SPNs (black; that did not show layer 4 inputs) (p < 0.001), while the inhibitory extent is only slightly larger (p = 0.048). Plotted are means + SD. D, Columnar width of excitation for Group 1 (black) and Group 2 (red) SPNs. Plotted are means + SD. There was a slight increase between P6 and P14 for Group 1 (p < 0.05). E, Columnar width of inhibition for Group 1 and Group 2 SPNs. Plotted are means + SD. The columnar width of inhibition of Group 1 SPNs increases between P2 and P14 as well as between P6 and P14 (p < 0.05). F, Average amplitude for EPSCs and IPSCs originating in layer 4 at different ages. Plotted are means + SEM. Amplitudes do not increase over development (p > 0.1; ANOVA).
Figure 7.
Figure 7.
Layer 4 neurons influence a subpopulation of cells in the subplate. A, Two-photon photostimulation combined with two-photon Ca2+ imaging. Shown is an image of layer 4 neurons loaded with OGB-1 AM. Scale bar, 20 μm. The circles indicate the area over which fluorescence was measured. The green dots indicate stimulation locations around the blue cell. B, Histogram shows location of stimulated neuron relative to pia. Stimulated neurons were located at 407 ± 70 μm from the pia, and thus are located in the middle of layer 4. C, Graphs show fluorescence changes in seven cells in layer 4 after stimulation of blue cell (stimulation time indicated by “hν” and vertical dashed line). Frame duration was 48.8 ms. Note large fluorescence increases in stimulated cell (blue) and smaller shorter duration increases in three other cells. Note that many cells in close vicinity to the stimulated cell did not show any Ca2+ increases. The right graph shows the responses at the onset of stimulation. D, Stimulation of layer 4 neuron results in fluorescence changes in cells in cortical plate and subplate. Fluorescent image and overlay showing location of stimulated neuron (marked blue) and imaged cell bodies in cortical plate and subplate. Imaged but not responding cells are marked green, while responding cells are marked red. Scale bar, 100 μm. The white dashed line indicates layer 6/subplate boundary estimated from DIC. Ventricle is indicated by “v.” E, Traces show fluorescence transients (mean ± SEM) in stimulated cell (“1”) and responding cells in subplate (“2” to “10”). Calibration bar indicates 10% dF/F and applies to all traces. The dashed vertical line indicates time of layer 4 stimulation. While many cells showed fluorescence increases, cells could also show fluorescence decreases or combinations of increases and decreases (i.e., cells 9 and 10). This could be due to the potential activation of more than one layer 4 neuron, different receptors in postsynaptic cells, activation of inhibitory neurons, or intrinsic differences between cells.
Figure 8.
Figure 8.
Laminar differences within subplate. The bar graph shows the location (mean + SD) of Group 1 and Group 2 SPNs within subplate at different ages. The location of the subplate–layer 6 border is indicated by 1, and the ventricle is at location 0. At P10–P14, Group 2 SPNs that receive layer 4 inputs are located closer to the pia than Group 1 SPNs that do not (p < 0.05).
Figure 9.
Figure 9.
Model circuit of SPNs in auditory cortex. Excitatory SPNs receive input from MGN, while inhibitory SPNs do not receive inputs from MGN but from other unknown sources (“?”). Excitatory SPNs project to layer 4 and to other SPNs, while the projection targets of inhibitory SPNs are unknown. In the second postnatal week, superficial SPNs start to receive excitatory and inhibitory feedback connections from layer 4, while deep SPNs do not.

Similar articles

Cited by

References

    1. Brill J, Huguenard JR. Robust short-latency perisomatic inhibition onto neocortical pyramidal cells detected by laser-scanning photostimulation. J Neurosci. 2009;29:7413–7423. - PMC - PubMed
    1. Colonnese MT, Kaminska A, Minlebaev M, Milh M, Bloem B, Lescure S, Moriette G, Chiron C, Ben-Ari Y, Khazipov R. A conserved switch in sensory processing prepares developing neocortex for vision. Neuron. 2010;67:480–498. - PMC - PubMed
    1. Cruikshank SJ, Rose HJ, Metherate R. Auditory thalamocortical synaptic transmission in vitro. J Neurophysiol. 2002;87:361–384. - PubMed
    1. de Villers-Sidani E, Chang EF, Bao S, Merzenich MM. Critical period window for spectral tuning defined in the primary auditory cortex (A1) in the rat. J Neurosci. 2007;27:180–189. - PMC - PubMed
    1. Failor S, Nguyen V, Darcy DP, Cang J, Wendland MF, Stryker MP, McQuillen PS. Neonatal cerebral hypoxia–ischemia impairs plasticity in rat visual cortex. J Neurosci. 2010;30:81–92. - PMC - PubMed

Publication types

LinkOut - more resources