Comparative Study
. 2012 Feb 1;32(5):1602-11.
doi: 10.1523/JNEUROSCI.5601-11.2012.

LRRK2 inhibition attenuates microglial inflammatory responses

Affiliations
Comparative Study

LRRK2 inhibition attenuates microglial inflammatory responses

Mark S Moehle et al. J Neurosci. .

Erratum in

Abstract

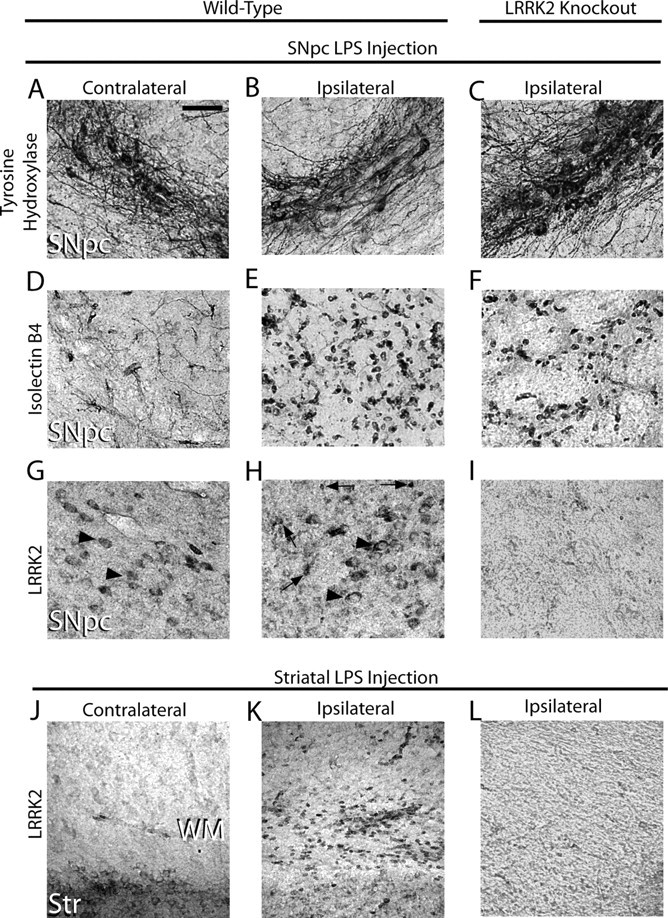
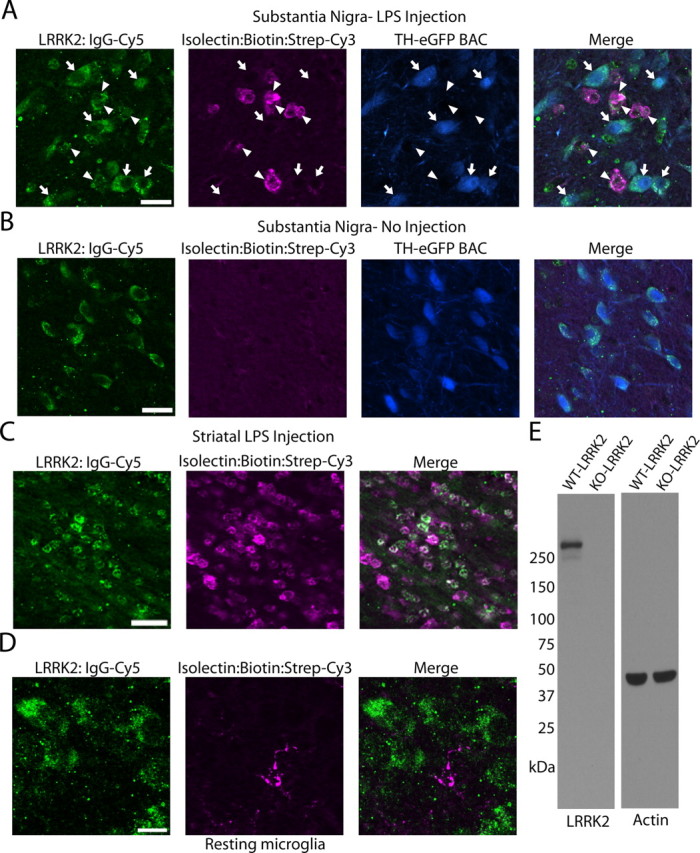
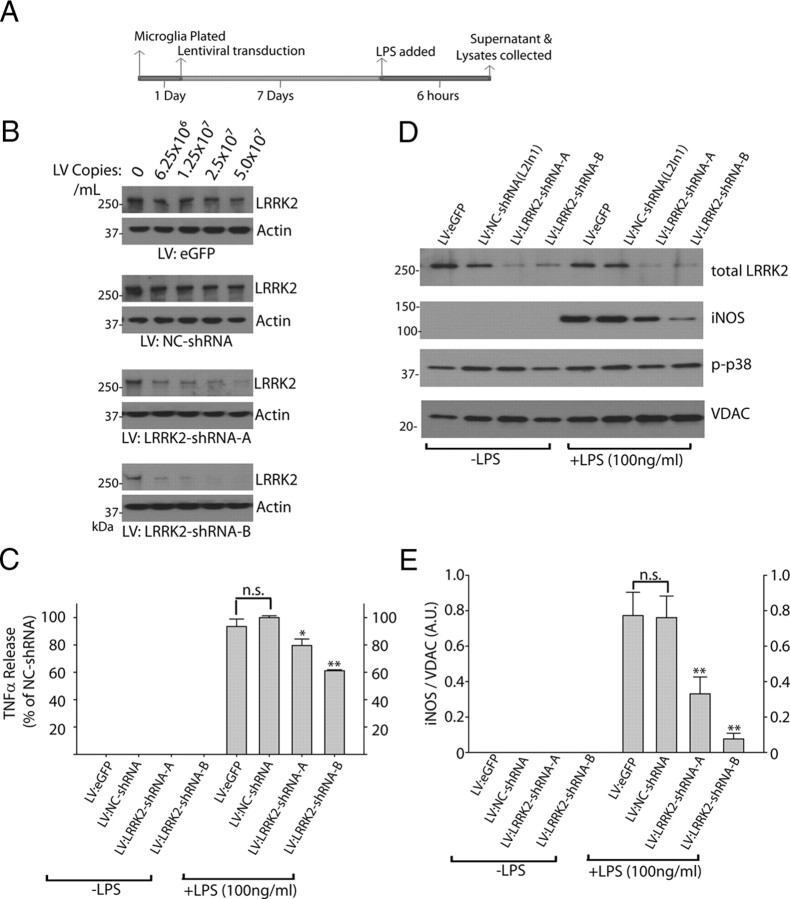
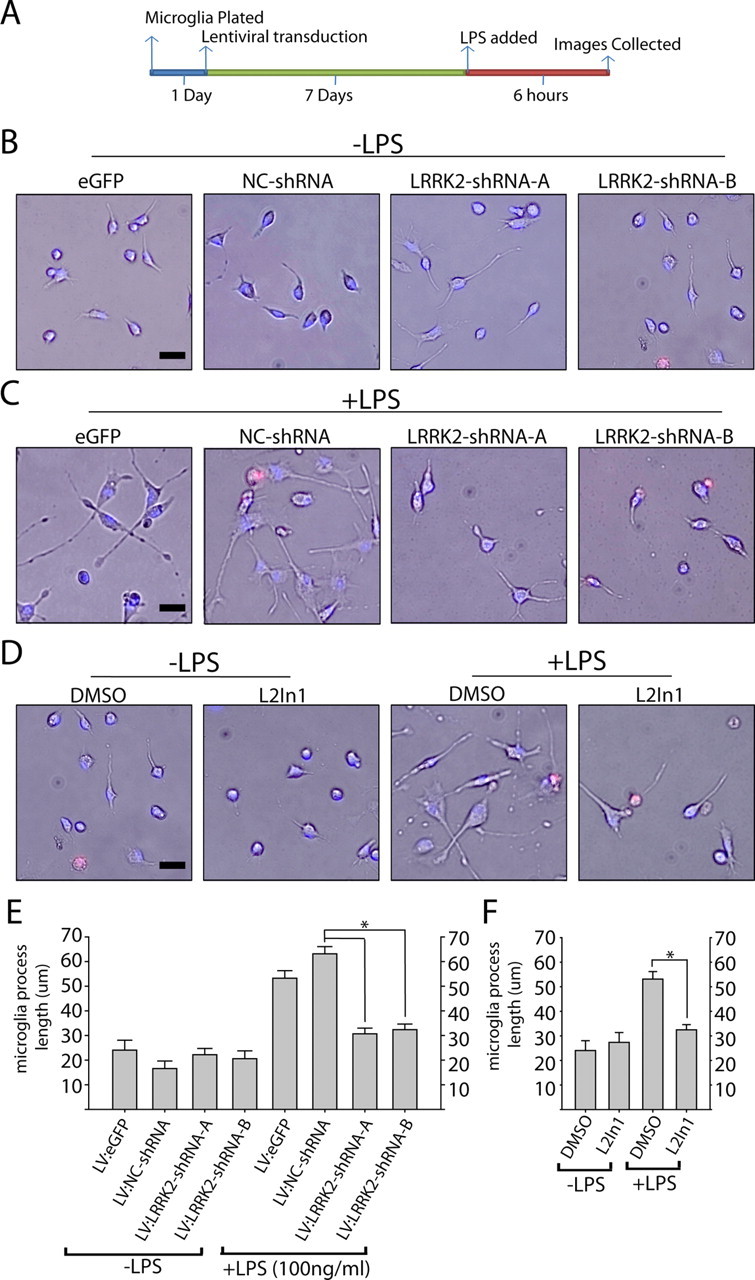
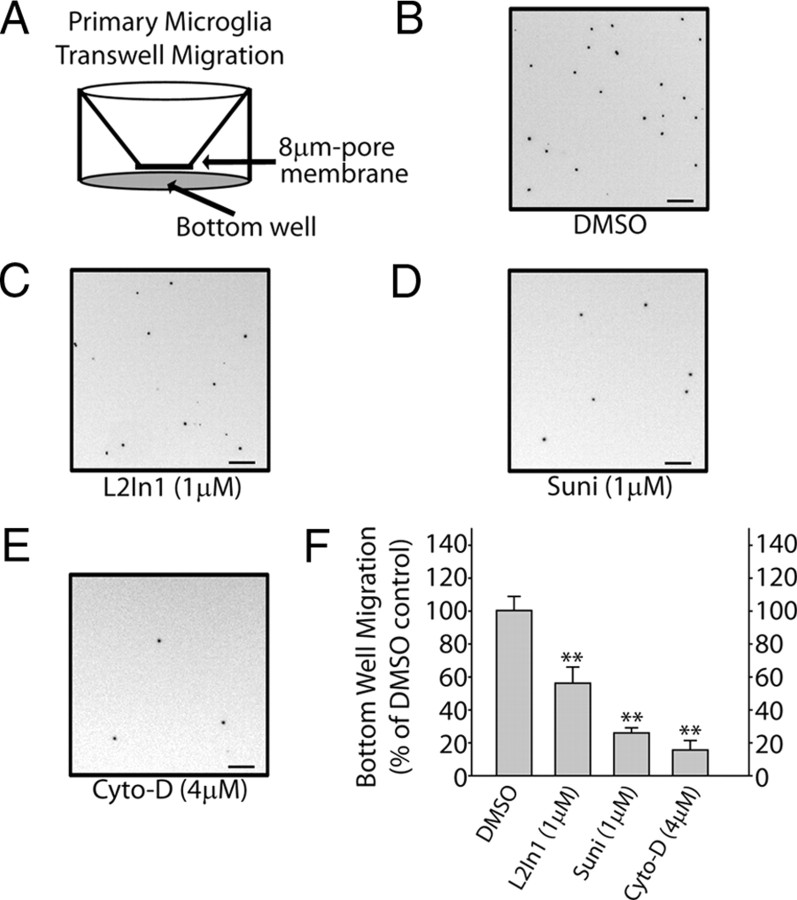
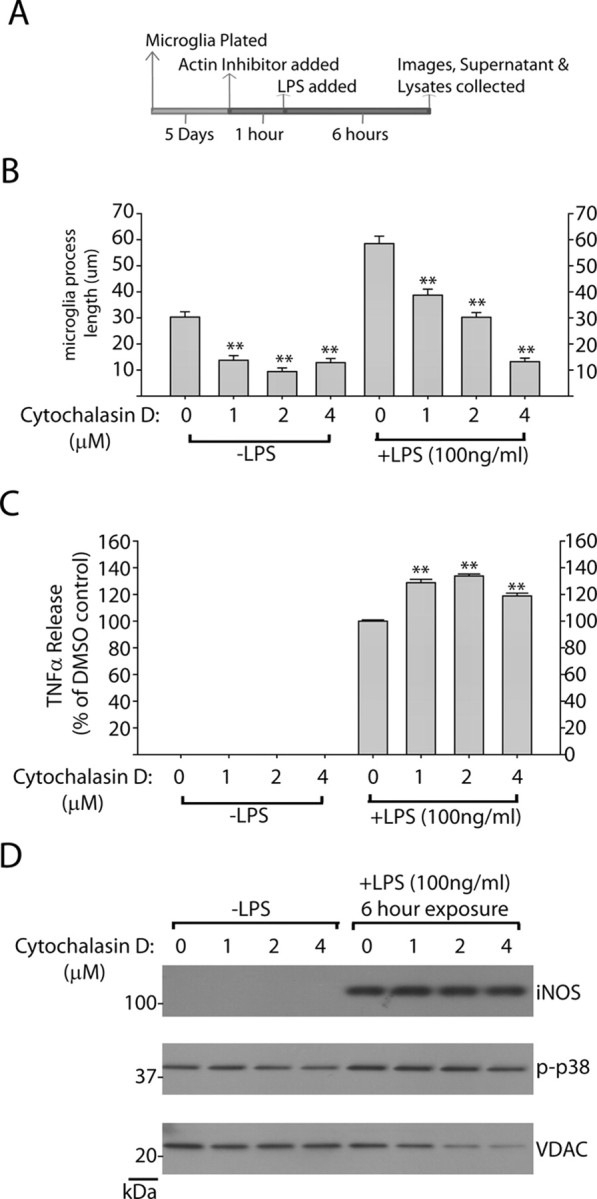
Missense mutations in leucine-rich repeat kinase 2 (LRRK2) cause late-onset Parkinson's disease (PD), and common genetic variation in LRRK2 modifies susceptibility to Crohn's disease and leprosy. High levels of LRRK2 expression in peripheral monocytes and macrophages suggest a role for LRRK2 in these cells, yet little is known about LRRK2 expression and function in immune cells of the brain. Here, we demonstrate a role for LRRK2 in mediating microglial proinflammatory responses and morphology. In a murine model of neuroinflammation, we observe robust induction of LRRK2 in microglia. Experiments with toll-like receptor 4 (TLR4)-stimulated rat primary microglia show that inflammation increases LRRK2 activity and expression, while inhibition of LRRK2 kinase activity or knockdown of protein attenuates TNFα secretion and nitric oxide synthase (iNOS) induction. LRRK2 inhibition blocks TLR4 stimulated microglial process outgrowth and impairs ADP stimulated microglial chemotaxis. However, actin inhibitors that phenocopy inhibition of process outgrowth and chemotaxis fail to modify TLR4 stimulation of TNFα secretion and inducible iNOS induction, suggesting that LRRK2 acts upstream of cytoskeleton control as a stress-responsive kinase. These data demonstrate LRRK2 in regulating responses in immune cells of the brain and further implicate microglial involvement in late-onset PD.


Figures

Figure 1.
Figure 1.
TLR4 stimulationPer triggers LRRK2 expression in microglia cells. Five micrograms of LPS (Escherichia coli 0111:B4) was unilaterally injected into the SNpc or striatum of 12-week-old male WT and LRRK2 KO C57BL/6J 12 mice. A–L, Immunohistochemistry for TH (A–C), isolectin B4 (marker for microglia and endothelial cells) (D–F), or LRRK2 was performed on serial coronal sections spanning the SNpc and striatum (G–L). Arrowheads indicate LRRK2 immunoreactivity on cells in the SNpc with the size and location of TH-positive neurons on both the contralateral and ipsilateral injection sides. Arrows indicate intense LRRK2 staining in numerous small cells observed exclusively on the ipsilateral side. WM, White matter; Str, striatum. No specific cellular staining in these areas was observed when primary antibodies were replaced with species-matched whole IgG (data not shown). Scale bar: AL (in A), 50 μm.
Figure 2.
Figure 2.
LRRK2 colocalizes with TLR4-stimulated microglia. TH-EGFP BAC mice were unilaterally injected with 5 μg of LPS (E. coli 0111:B4) into the SNpc or striatum. A, Using a triple-staining protocol (anti-rabbit IgG-Cy5 to detect LRRK2 antibody, ExtraAvidin-Cy3 to detect Isolectin-B4:biotin-positive cells, EGFP epifluorescence in TH-positive cells), LRRK2-labeled cells were observed in the SNpc as either large (arrows) or small (arrowheads) cells that colocalized with EGFP (arrows) or isolectin (arrowheads). Scale bar, 20 μm. B, LRRK2 staining in the SNpc in control no-injection mice. Scale bar, 20 μm. C, In striatal injected mice, LRRK2 was observed colocalized with most microglial cells in the white matter projection tract. Scale bar, 30 μm. D, LRRK2 staining could not be detected in microglia with resting morphology. Scale bar, 10 μm. Overlap of green (LRRK2) and magenta (microglia) is white, and overlap of blue (TH-positive cells) and green (LRRK2) is cyan. E, Western blot for LRRK2 with 20 μg of total protein lysate loaded per well that was derived from LRRK2 KO or WT whole-brain tissue.
Figure 3.
Figure 3.
LRRK2 induction by TLR4 stimulation. A, Five micrograms of LPS or no LPS control was bilaterally injected into the SNpc of FLAG-LRRK2 mice (Jackson Laboratory strain 012466), the SNpc was dissected after 24 h, and FLAG-LRRK2 was immunoprecipitated and treated with ATP. Eluted protein was analyzed by Western blot with either a total LRRK2 antibody- or autophosphorylation-specific pT1503 antibody. B, Quantification of pT1503-autophosphorylated LRRK2 normalized to total LRRK2 from four LPS-injected mice and four injection control mice. C, Specificity of the pT1503 antibody is demonstrated by LRRK2 recombinant protein derived from transiently transfected HEK-293FT cells. D, Primary cultures derived from P2 rats were analyzed by Western blot for cell type-specific markers and LRRK2 expression. Lysates were normalized to actin, and ∼20 μg of protein was loaded per lane. E, F, Primary microglia treated with various concentrations of LPS for 12 h and LRRK2 expression evaluated by Western blot (E), with quantification normalized to actin for three independent experiments (F). G, mRNA levels of LRRK2 were determined by relative quantification (ΔΔcT) normalized to TBP. H, Representative immunofluorescence of LRRK2 staining in primary microglia cultures treated with LPS or control (-LPS) for 12 h. I, Human LRRK2 expression characterized by Western blot in human primary microglia cultures compared with human macrophage/monocyte THP-1 cells. J, THP-1 cells treated with 100 ng of LPS for the indicated time and lysates analyzed by Western blot (J), with quantification of LRRK2 levels from three independent experiments (K). *p < 0.01, two-tailed unpaired t test (B); *p<0.01, one-way ANOVA with Tukey–Kramer test (B, F, K), with respect to initial LRRK2 expression. Error bars indicate SEM.
Figure 4.
Figure 4.
LRRK2 kinase inhibition attenuates inflammatory signaling in microglia. A, B, Calculation of the inhibitory potential of the LRRK2 targeted compounds L2in1 (A) and sunitinib (B) using standardized in vitro kinase assays consisting of 30 nm LRRK2 enzyme, 50 μm peptide, and 100 μm ATP with reactions run for 30 min. IC50 values were calculated through nonlinear regression with r2 values of 0.960 and 0.968, respectively, for L2in1 and Sunitinib. C, Graphical depiction of the experimental timeline used to generate lysates and serum from primary microglia analyzed in D–G. D, Quantification of secreted TNFα by ELISA after a 6 h exposure to LPS. Suni, Sunitinib. Drug concentrations are given in micromoles, and mean values are calculated from three independent experiments. E, TNFα mRNA was measured by quantitative PCR (ΔΔcT) normalized to TBP, and mean values are calculated from three independent experiments. F, Representative Western blot analysis of primary microglia lysates. G, Quantification of three independent experiments with levels of iNOS and phospho-p38 levels normalized to VDAC expression. *p < 0.05, **p < 0.01, one-way ANOVA with Tukey–Kramer test, with respect to DMSO (+LPS) conditions. Error bars indicate SEM.
Figure 5.
Figure 5.
LRRK2 knockdown attenuates inflammatory signaling in microglia. A, Graphical depiction of the experimental timeline used to generate lysates and serum from primary microglia cultures. B, A total of 5 × 10⁵ primary microglia per condition were exposed to the indicated copies of purified lentivirus encoding EGFP (no RNAi control), a noncoding control shRNA (NC-shRNA), or LRRK2 shRNAs (A, B), in 0.5 ml in culture. C, Serum from primary microglia treated with 2 × 10⁷ lentiviral copies/ml of the respective lentivirus for 7 d were analyzed for TNFα secretion 6 h post-LPS (100 ng/ml) or control exposures. Results are calculated from three independent experiments. D, Primary microglia exposed to LPS for 6 h as indicated were lysed in SDS buffer and analyzed by Western blot. Two micrograms of total protein was loaded per lane and analyzed with the indicated antibody. VDAC is used as a loading control. Blots shown are representative of three independent experiments. E, Quantification of iNOS levels normalized to VDAC expression. *p < 0.05, **p < 0.01 by one-way ANOVA with Tukey–Kramer, with respect to LV-NC-shRNA (+LPS) conditions. Error bars indicate SEM.
Figure 6.
Figure 6.
LRRK2 controls TLR4-responsive process outgrowth. A, Graphical depiction of the experimental timeline. B–D, Representative phase-contrast images with Hoechst stain (blue) and propidium iodide (red) stain overlay. Scale bars, 40 μm. E, F, Quantification of average microglia process length calculated from >150 microglia analyzed from three experiments per condition. L2in1 was used at 1 μm concentration with a 1 h pretreatment before LPS addition. Round cells with healthy nuclear staining but no process extensions were counted as 0 for process length determination, and propidium iodide-positive cells or cells with abnormal Hoechst staining (<10% of cells in every condition) were excluded from analysis. *p < 0.01 compared with LV:NC-shRNA/+LPS (E) or DMSO/+LPS (F) as determined by one-way ANOVA with Tukey–Kramer test. Error bars are SEM.
Figure 7.
Figure 7.
LRRK2 inhibition impairs microglial chemotaxis. A, Graphical depiction of experimental approach. The bottom chamber is supplemented with 100 μm ADP, and microglia are allowed to migrate through the 8 μm pore membrane over a 30 h period of time to the bottom chamber. B–E, Representative depiction of a 0.5 mm2 area of the bottom chamber with cells stained with Hoechst dye. Suni, Sunitinib; Cyto-D, cytochalasin D. F, Relative quantification of the number of microglia migrating to the bottom chamber, calculated from three independent experiments. **p < 0.01 as determined by one-way ANOVA with Tukey–Kramer test. Error bars indicate SEM.
Figure 8.
Figure 8.
Inhibition of microglial process outgrowth does not affect proinflammatory signaling. A, Graphical depiction of experimental approach. B, Quantification of average microglia process length in response to the indicated concentration of cytochalasin D. Mean lengths were calculated from >150 microglia analyzed from three independent experiments per condition. Round cells with healthy nuclear staining but no process extensions were counted as 0 for process length determination, and propidium iodide-positive cells or cells with abnormal Hoechst staining (<10% of cells in every condition) were excluded from analysis. C, Quantification of secreted TNFα by ELISA after a 6 h exposure to LPS in the presence of the indicated concentration of cytochalsin D. Mean values were calculated from three independent experiments. D, Representative Western blots demonstrating levels of iNOS and phospho-p38 levels in response to LPS addition in the presence of cytochalsin D or control. No significant differences in iNOS or phospho-p38 levels could be detected over three independent experiments. **p < 0.01 as determined by one-way ANOVA with Tukey–Kramer test. Error bars indicate SEM.

References

    1. Alegre-Abarrategui J, Christian H, Lufino MM, Mutihac R, Venda LL, Ansorge O, Wade-Martins R. LRRK2 regulates autophagic activity and localizes to specific membrane microdomains in a novel human genomic reporter cellular model. Hum Mol Genet. 2009;18:4022–4034. - PMC - PubMed
    1. Balcaitis S, Weinstein JR, Li S, Chamberlain JS, Möller T. Lentiviral transduction of microglial cells. Glia. 2005;50:48–55. - PubMed
    1. Biskup S, Moore DJ, Celsi F, Higashi S, West AB, Andrabi SA, Kurkinen K, Yu SW, Savitt JM, Waldvogel HJ, Faull RL, Emson PC, Torp R, Ottersen OP, Dawson TM, Dawson VL. Localization of LRRK2 to membranous and vesicular structures in mammalian brain. Ann Neurol. 2006;60:557–569. - PubMed
    1. Bosgraaf L, Van Haastert PJ. Roc, a Ras/GTPase domain in complex proteins. Biochim Biophys Acta. 2003;1643:5–10. - PubMed
    1. Davalos D, Grutzendler J, Yang G, Kim JV, Zuo Y, Jung S, Littman DR, Dustin ML, Gan WB. ATP mediates rapid microglial response to local brain injury in vivo. Nat Neurosci. 2005;8:752–758. - PubMed

Publication types

MeSH terms

Substances