Comparative Study
. 2012 Feb 1;32(5):1714-29.
doi: 10.1523/JNEUROSCI.5433-11.2012.

Novel GαS-protein signaling associated with membrane-tethered amyloid precursor protein intracellular domain

Affiliations
Comparative Study

Novel GαS-protein signaling associated with membrane-tethered amyloid precursor protein intracellular domain

Carole Deyts et al. J Neurosci. .

Abstract

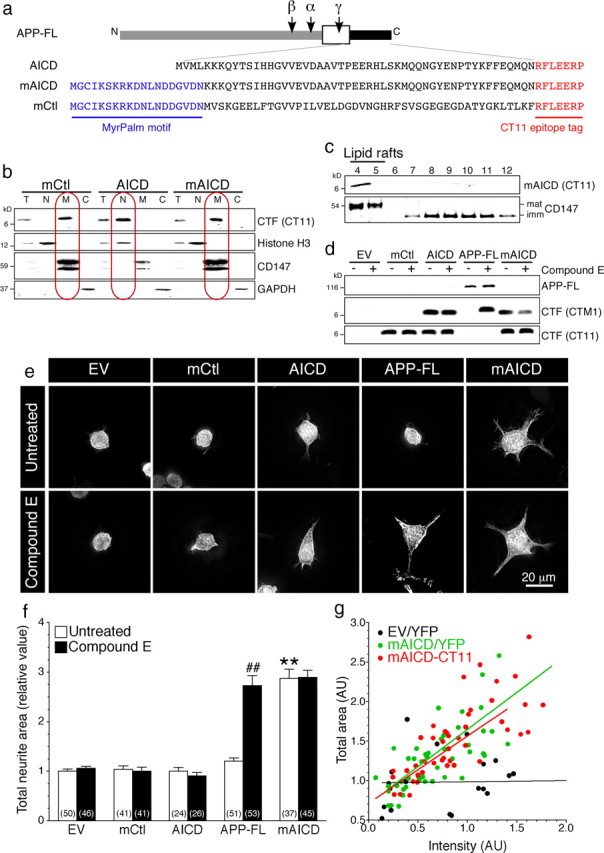
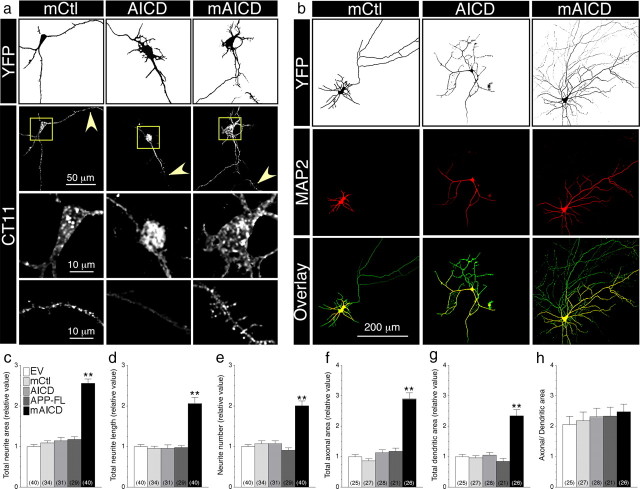
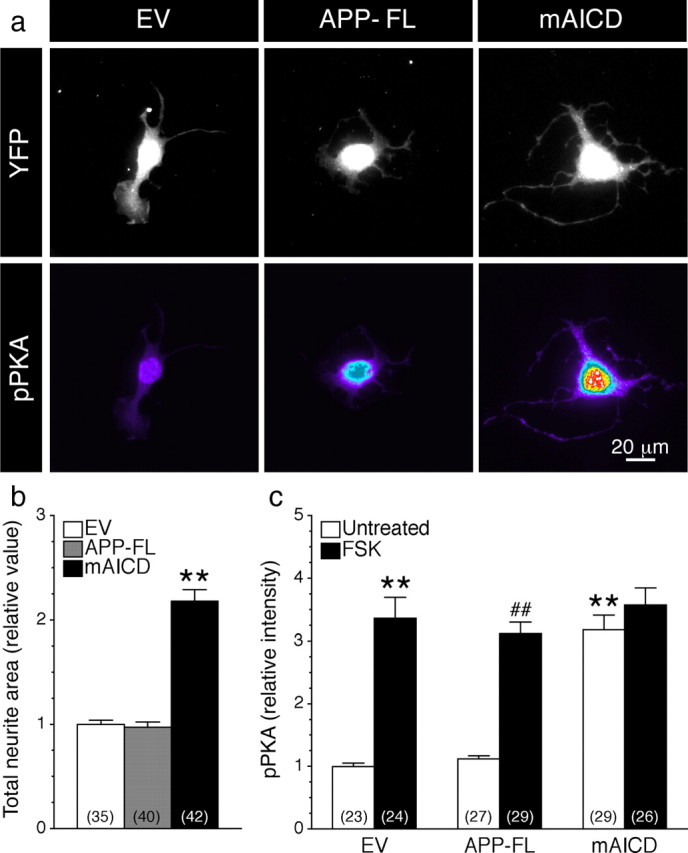
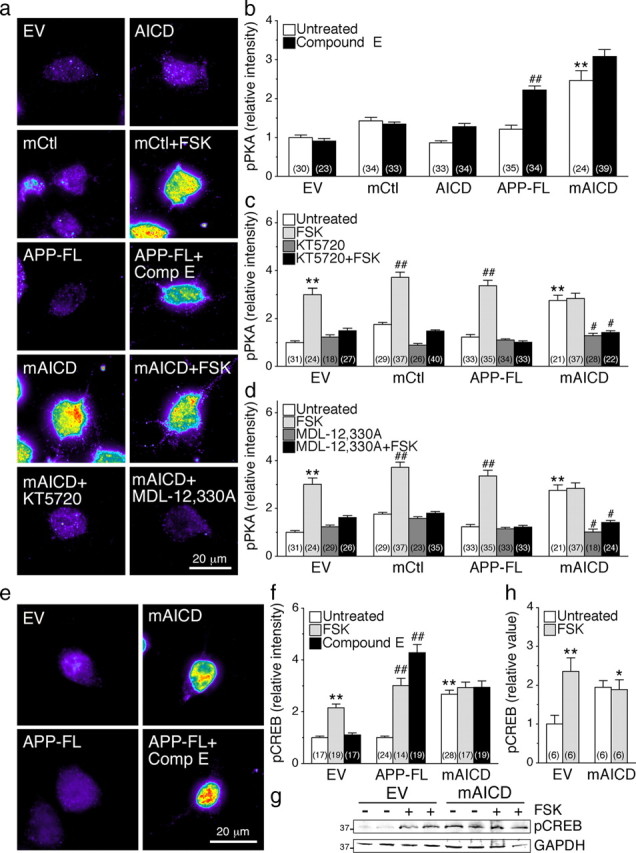
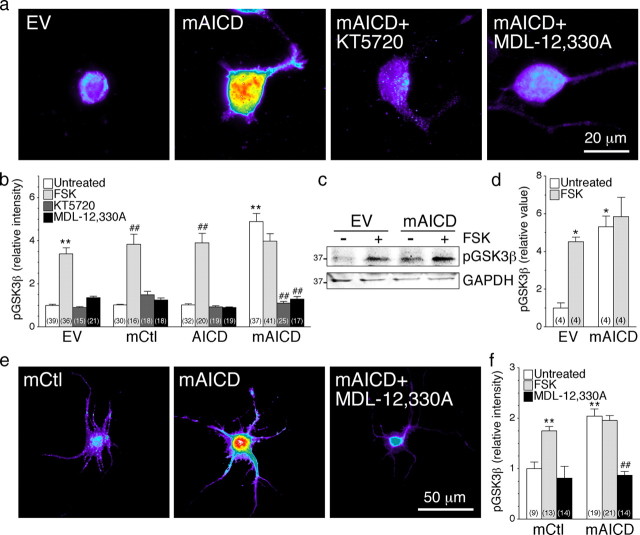
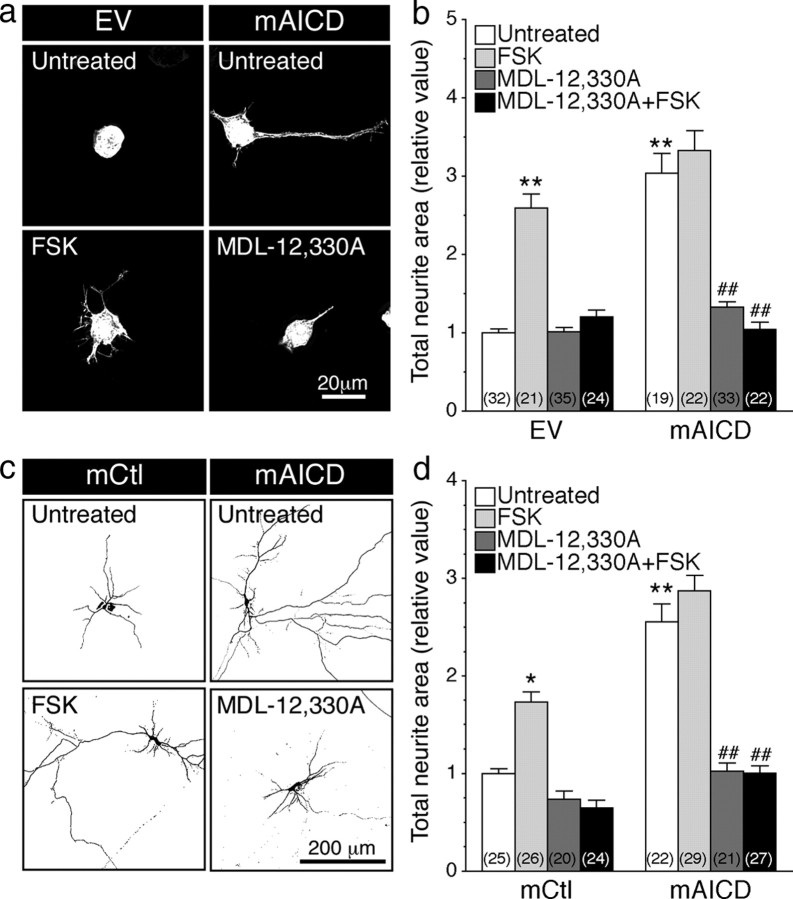
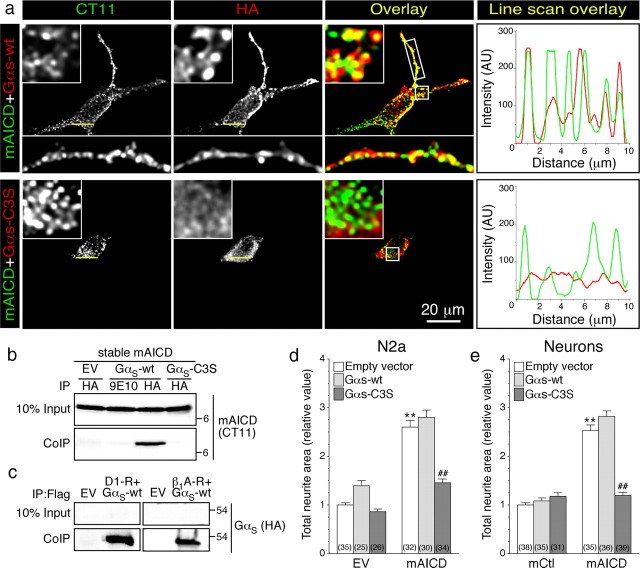
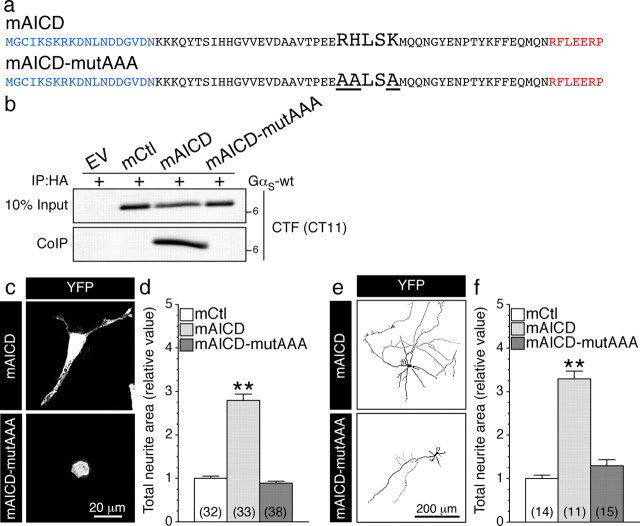
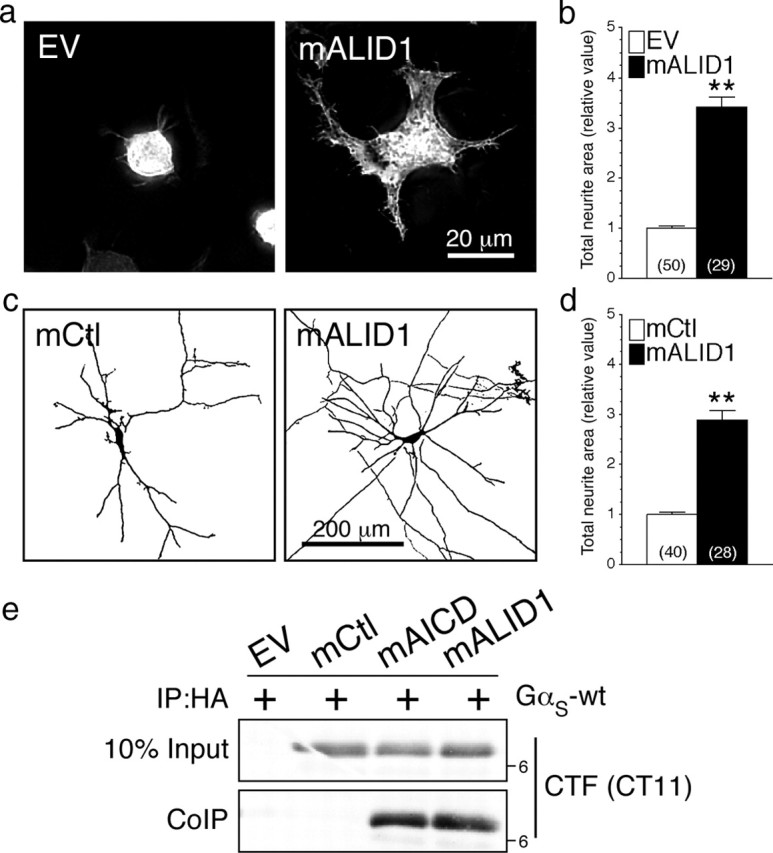
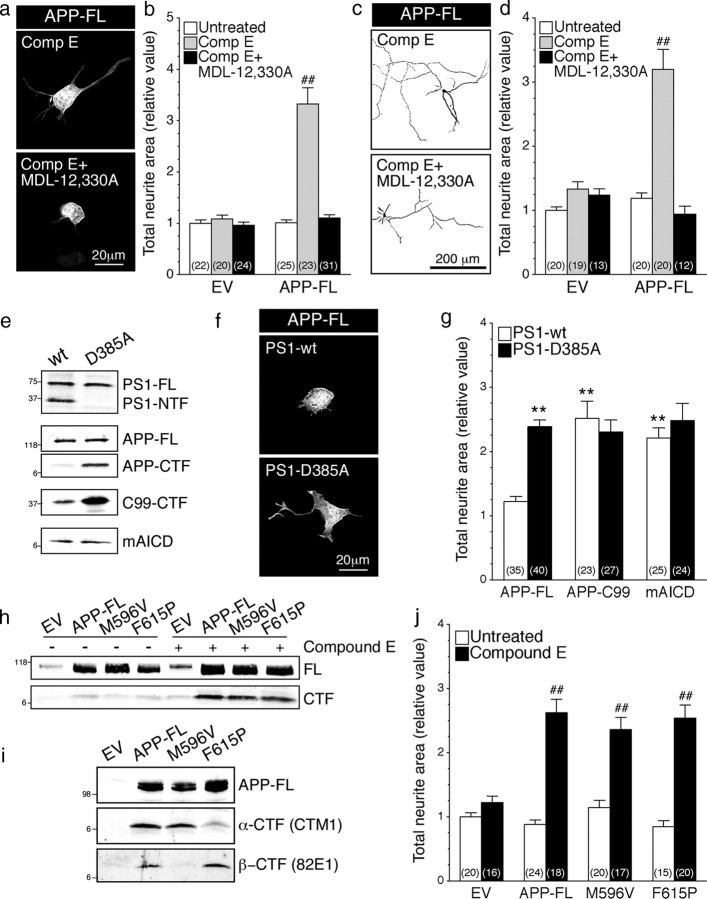
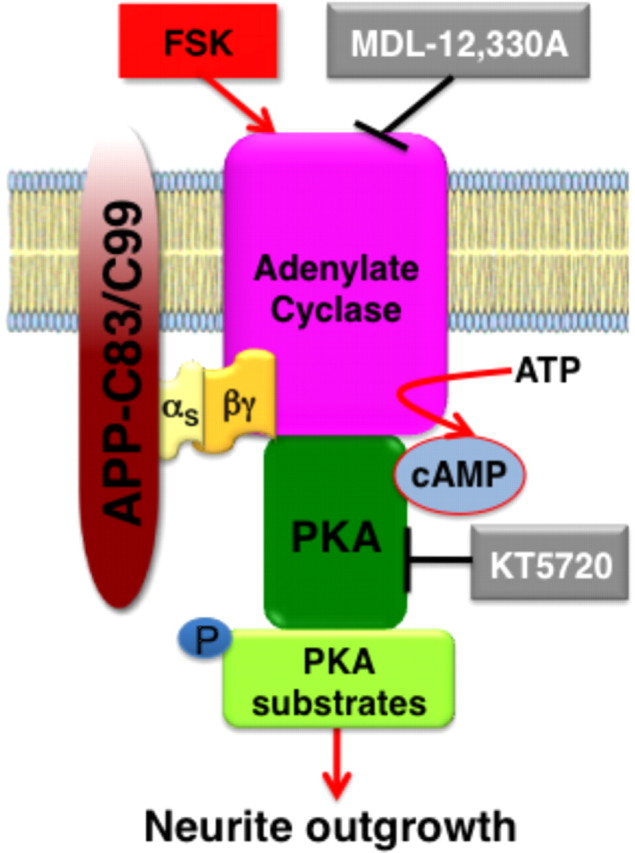
Numerous physiological functions, including a role as a cell surface receptor, have been ascribed to Alzheimer's disease-associated amyloid precursor protein (APP). However, detailed analysis of intracellular signaling mediated by APP in neurons has been lacking. Here, we characterized intrinsic signaling associated with membrane-bound APP C-terminal fragments, which are generated following APP ectodomain release by α- or β-secretase cleavage. We found that accumulation of APP C-terminal fragments or expression of membrane-tethered APP intracellular domain results in adenylate cyclase-dependent activation of PKA (protein kinase A) and inhibition of GSK3β signaling cascades, and enhancement of axodendritic arborization in rat immortalized hippocampal neurons, mouse primary cortical neurons, and mouse neuroblastoma. We discovered an interaction between BBXXB motif of APP intracellular domain and the heterotrimeric G-protein subunit Gα(S), and demonstrate that Gα(S) coupling to adenylate cyclase mediates membrane-tethered APP intracellular domain-induced neurite outgrowth. Our study provides clear evidence that APP intracellular domain can have a nontranscriptional role in regulating neurite outgrowth through its membrane association. The novel functional coupling of membrane-bound APP C-terminal fragments with Gα(S) signaling identified in this study could impact several brain functions such as synaptic plasticity and memory formation.


Figures

Figure 1.
Figure 1.
Accumulation of membrane-bound APP intracellular domain enhances neurite outgrowth in N2a cells. a, Schematic representation of full-length and C-terminal APP constructs. b, Analysis of mCtl, AICD, and mAICD distribution by subcellular fractionation of total lysates (T). Histone H3, CD147, and GAPDH were used as markers for nuclear (N), membrane (M), and cytosolic (C) fractions, respectively. c, Sucrose density gradient fractionation of lipid rafts in N2a pools stably expressing mAICD. Detergent-insoluble membrane proteins are enriched in fractions 4–5 marked by mature CD147 protein and flotillin-2 (data not shown), whereas detergent-soluble membrane proteins are found in 8–12 fractions marked by immature CD147 protein (Vetrivel et al., 2004, 2008). d, Immunoblot analysis of transfected cells without or after treatment with Compound E (10 nm; 24 h). CT11 antibody recognizes CT11 epitope-tagged polypeptides, whereas CTM1 detects the C terminus of APP (von Koch et al., 1997; Vetrivel et al., 2009). e, YFP fluorescence images of N2a cells cotransfected with YFP and the indicated plasmids. f, Quantitative analysis of total neurite area relative to EV cells quantified from z-stack images. g, Correlation analysis between the total area and mAICD expression quantified by CT11 immunostaining (red circles) or cotransfected YFP fluorescence intensity (green circles). The black circles represent analysis of cells cotransfected with YFP and EV. Statistical analysis was performed using ANOVA Kruskal–Wallis test followed by Dunn's post hoc multiple-comparison analysis. The total number of cells quantified is shown in parentheses. **p < 0.001, compared with EV-transfected cells, and ##p < 0.001, Compound E-treated cells compared with untreated cells in each case. Error bars indicate SEM.
Figure 2.
Figure 2.
Membrane-tethered APP intracellular domain promotes exuberant axonal and dendritic arborization in mouse cortical neurons. a, Distribution of mCtl, AICD, and mAICD in primary cortical neurons (8–14 DIV) cotransfected with YFP and the indicated plasmids and immunostained with CT11 antibody. Z-stack images (200 nm interval) were deconvolved and processed for quantification. YFP fluorescence is depicted as inverted images. The bottom two panels represent CT11 staining in enlarged somatic (boxed region) and dendritic areas (indicated by arrowheads). b, Neurons were transfected as above and immunostained with MAP2 antibody. YFP fluorescence is shown as inverted image, and MAP2 staining is shown in red. Overlay images (bottom panel) reveal axons (green) and dendrites (yellow). c–h, Quantitative analysis of neurite outgrowth. Total neurite area (c), total neurite length (d), and neurite number (e) in primary cortical neurons expressing various constructs are plotted relative to YFP/EV-transfected neurons. Total axonal (f) and dendritic areas (g) were also quantified in the same groups of neurons. Differences in axonal and dendritic networks are shown as a change in the ratio between both areas (h). Statistical analysis was performed using ANOVA Kruskal–Wallis test followed by Dunn's post hoc multiple-comparison analysis. **p < 0.001, compared with neurons transfected with an EV control. The total number of quantified neurons is shown in parentheses. Error bars indicate SEM.
Figure 3.
Figure 3.
Accumulation of membrane-tethered APP intracellular domain-induced neurite outgrowth parallels phosphorylation of PKA substrates in hippocampal H19-7 cells. a, H19-7 cells cotransfected with YFP and EV, APP-FL, or mAICD were allowed to differentiate for 24 h and immunostained with an antibody directed against phosphorylated Ser/Thr PKA substrates (pPKA) (Grønborg et al., 2002). Images of YFP fluorescence are shown in gray, whereas intensity of pPKA staining is shown in pseudocolor. b, Total neurite area was quantified as described in Materials and Methods and plotted relative to EV-transfected cells. c, The intensity of pPKA staining was quantified and plotted relative to the signal intensity in EV-transfected cells. The black bars represent the signal in cells treated with FSK (50 μm; 30 min). Statistical analysis was performed using ANOVA Kruskal–Wallis test followed by Dunn's post hoc multiple-comparison analysis. **p < 0.001, compared with EV untreated cells, and ##p < 0.001, compared with untreated cells within the same transfected conditions. The total number of quantified cells is shown in parentheses. Error bars indicate SEM.
Figure 4.
Figure 4.
Activation of cAMP/PKA pathway in N2a cells expressing membrane-tethered APP intracellular domain. N2a cells cotransfected with YFP and EV, mCtl, AICD, APP-FL, or mAICD were immunostained with phosphorylated Ser/Thr PKA substrate antibody (pPKA) (Grønborg et al., 2002) or phosphorylated (Ser133) CREB antibody (pCREB) (Ginty et al., 1993). a, Representative pseudocolor images of pPKA immunofluorescence staining intensity in treated or untreated cells expressing various constructs. b–d, Quantitative analysis of pPKA staining intensity. Changes in pPKA staining intensity following treatment with Compound E (10 nm; 24 h) (b), adenylate cyclase activator FSK (50 μm; 30 min) and PKA inhibitor KT5720 (2 μm; 30 min) (c), and adenylate cyclase inhibitor MDL-12,330A (10 nm; 30 min) (d) were plotted. e, Representative pseudocolor images of pCREB immunofluorescence in cells expressing EV, mAICD, or APP-FL. f, Changes in the levels of pCREB staining intensity under basal conditions and after treatment with FSK or Compound E are plotted. g, Representative Western blot of pCREB in stable N2a cells expressing EV or mAICD without or after FSK stimulation (50 μm; 30 min) is shown. GAPDH was used for loading control. h, Quantitative analysis is shown as relative change in the ratio of pCREB intensity over intensity of EV control. Statistical analysis was performed using ANOVA Kruskal–Wallis test followed by Dunn's post hoc multiple-comparison analysis. *p < 0.05, **p < 0.001, compared with untreated EV-transfected cells; and #p < 0.05, ##p < 0.001, compared with untreated cells within the same transfected conditions. The total number of quantified cells is shown in parentheses. Error bars indicate SEM.
Figure 5.
Figure 5.
cAMP/PKA-dependent inhibition of GSK3β pathway in cells expressing membrane-tethered APP intracellular domain. N2a cells coexpressing YFP and EV, mCtl, AICD, or mAICD were immunostained with antibodies directed against phosphorylated (Ser9) GSK3β (pGSK3β). CCD images were acquired (100× objective) and processed by applying a common threshold between groups using MetaMorph software. Representative pseudocolor images of N2a cells (a) and cortical neurons (e) show pGSK3β staining intensity in treated or untreated cells expressing various constructs. b, f, Quantitative analysis of pGSK3β staining intensity is represented as relative changes compared with EV or mCtl basal level. Changes in intensity levels are shown after FSK stimulation (50 μm; 30 min) before and after treatment with PKA (KT5720; 2 μm, 1 h) or adenylate cyclase (MDL-12,330A; 10 nm, 1 h) inhibitors. c, Representative Western blot of pGSK3β in stable N2a cells expressing EV or mAICD under basal conditions and after treatment with FSK. GAPDH was used for loading control. d, Quantitative analysis is shown as relative change in the ratio of pGSK3β intensity over intensity of EV control. Statistical analysis was performed using ANOVA Kruskal–Wallis test followed by Dunn's post hoc multiple-comparison analysis for immunostaining and Tukey's multiple-comparison test for Western blots. *p < 0.05, **p < 0.001, compared with untreated EV-expressing cells; and ##p < 0.001, compared with untreated cells within the same transfected conditions. Total number of N2a cells (from at least 3 independent sets of cultures) used for quantification is shown in parentheses. Error bars indicate SEM.
Figure 6.
Figure 6.
Accumulation of membrane-tethered APP intracellular domain-induced neurite outgrowth requires adenylate cyclase activation. N2a cells and cortical neurons coexpressing YFP and EV, mCtl, or mAICD were stimulated with FSK (1 μm; 24 h) and/or treated with adenylate cyclase inhibitor MDL-12,330A (10 nm; 24 h), and neurite extensions were quantified as described in Materials and Methods. Representative images of N2a cells (a) or inverted images of cortical neurons (c) are shown. b, d, Three-dimensional deconvolved images were quantified, and morphological changes following FSK stimulation and/or application of adenylate cyclase inhibitor MDL-12,330A (10 nm; 24 h) are plotted as relative difference of total neurite area compared with untreated EV or mCtl controls. Statistical analysis was performed using ANOVA Kruskal–Wallis test followed by Dunn's post hoc multiple-comparison analysis. *p < 0.05, **p < 0.001, compared with untreated EV- or mCtl-expressing cells; ##p < 0.001, compared with untreated cells within the same transfected conditions. The total number of quantified cells is shown in parentheses. Error bars indicate SEM.
Figure 7.
Figure 7.
Functional coupling of membrane-tethered APP intracellular domain with GαS-protein. a, Immunofluorescence localization of mAICD and HA-tagged wild-type GαS (GαS-wt) or dominant-negative GαS mutant (GαS-C3S) in N2a cells. The boxed regions are shown as enlarged insets. Line scans (right panels) show overlapping peaks of mAICD (green) and GαS-wt (red) localization along a small stretch in the cell body. b, Coimmunoprecipitation analysis of mAICD interaction with GαS was evaluated in stable N2a cells expressing mAICD following transient transfection of GαS-wt. Non-denaturing lysates were immunoprecipitated with mAb HA or mAb 9E10 (negative control) and analyzed by immunoblotting with CT11 to detect mAICD. c, As positive control, interaction between dopamine D1 receptor (D1-R) or β1 adrenergic receptor (β1A-R) and GαS-wt was analyzed by coimmunoprecipitation. d, e, Quantification of neurite outgrowth in N2a cells (d) or cortical neurons (e) 24 h following cotransfection of EV, mCtl, or mAICD with GαS-Wt or GαS-C3S. Statistical significance was examined by ANOVA Kruskal–Wallis test followed by Dunn's post hoc multiple-comparison analysis. **p < 0.001, compared with EV/EV or EV/mCtl control cells. ##p < 0.001, compared with EV within mAICD transfected group when cells are G-protein transfected. The total number of quantified cells is shown in parentheses. Error bars indicate SEM.
Figure 8.
Figure 8.
APP intracellular domain BBXXB motif is required for interaction with GαS and mAICD-induced neurite outgrowth. a, The amino acid sequences of mAICD constructs are shown. The “BBXXB” motif RHLSK was mutated to AALSA to generate mAICD-mutAAA. b, Coimmunoprecipitation analysis of mAICD and mAICD-mutAAA with GαS in transfected N2a cells. Note that the BBXXB motif is essential for mAICD interaction with GαS. c, e, Representative images of N2a cells (c) and 8 DIV cortical neurons (e) coexpressing YFP and mAICD or mAICD-mutAAA. d, f, Analysis of the morphological changes in cells (or neurons) transfected with mAICD or mAICD-mutAAA were quantified from 3-D deconvolved image stacks that are plotted relative to cells (or neurons) transfected with mCtl. Statistical analysis was performed using ANOVA Kruskal–Wallis test followed by Dunn's post hoc multiple-comparison analysis. **p < 0.001, compared with mCtl-expressing N2a cells or cortical neurons. The total number of quantified cells is shown in parentheses. Error bars indicate SEM.
Figure 9.
Figure 9.
Functional coupling of membrane-targeted APLP1 homolog with GαS-protein. N2a cells and cortical neurons were cotransfected with YFP and EV or mALID1. Representative images of N2a cells (a) or inverted images of 8 DIV cortical neurons (c) expressing EV, mCtl, or mALID1 are shown. b, d, Three-dimensional deconvolved images were quantified and morphological changes are plotted as relative difference of total neurite area compared with EV or mCtl as described in Materials and Methods. e, Coimmunoprecipitation analysis of mALID1 interaction with GαS was evaluated in N2a cells transiently cotransfected with EV, mCtl, mAICD, or mALID1 and GαS-wt. Non-denaturing lysates were immunoprecipitated with mAb HA and analyzed by immunoblotting with CT11 to detect tagged mAICD and mALID1. Statistical analysis was performed using ANOVA Kruskal–Wallis test followed by Dunn's post hoc multiple-comparison analysis. **p < 0.001, compared with EV- or mCtl-expressing cells. The total number of cells quantified, from three independent experiments, is shown in parentheses. Error bars indicate SEM.
Figure 10.
Figure 10.
Accumulation of APP-CTF through γ-secretase inhibition induce neurite outgrowth. N2a cells and cortical neurons coexpressing YFP and EV or APP-FL were treated with Compound E (10 nm; 24 h) and/or adenylate cyclase inhibitor MDL-12,330A (10 nm; 30 min) and neurite extensions were quantified as described in Materials and Methods. Representative images of N2a cells (a) or inverted images of 8 DIV cortical neurons (c) coexpressing YFP and APP-FL are shown. b, d, Morphological changes were quantified and plotted relative to untreated EV/YFP cells. e–g, N2a cells stably expressing PS1-wt or PS1-D385A were transiently transfected with EV, APP-FL, APP-C99–6myc, or mAICD. e, The levels of PS1 and APP expression were analyzed by Western blotting using PS1NT and CTM1 antibodies, respectively. f, Representative images of N2a cells coexpressing YFP and APP-FL are shown. g, Quantitative analysis of total neurite area relative to EV control cells demonstrated that the loss of PS1 function affects neurite outgrowth in N2a cells. h–j, APP-CTF accumulation through differential secretase processing. N2a cells (h, j) and COS cells (i) were transiently transfected with EV, APP-FL, APP-M596V (APP β-site cleavage mutant), or APP-F615P (APP α-site cleavage mutant) and treated with or without Compound E (24 h; 10 nm). To detect α- and β-CTFs of APP, Western blotting analysis of Tris-Tricine gels was performed using rabbit polyclonal CTM1 and mouse monoclonal 82E1 antibodies. j, N2a cells were transiently transfected with EV or the indicated APP-FL variants. The total neurite area was quantified and plotted relative to untreated EV cells. Statistical analysis was performed using ANOVA Kruskal–Wallis test followed by Dunn's post hoc multiple-comparison analysis. **p < 0.001, compared with stable PS1-wt N2a cells expressing APP-FL. ##p < 0.001, compared with untreated cells or PS1-wt control cells within the same transfected condition. The total number of cells, quantified from at least three independent experiments, is shown in parentheses. Error bars indicate SEM.
Figure 11.
Figure 11.
G-protein-coupled signaling mediated by membrane-tethered APP intracellular domain. Our results show that accumulation of APP intracellular domain at the membrane initiates intracellular signaling that promotes neurite outgrowth. Membrane-tethered APP intracellular domain interacts with GαS through a “BBXXB” motif. This interaction elicits cAMP-dependent signaling cascade in neurons, leading to enhanced phosphorylation of PKA substrates such as CREB and GSK3β and enhanced axonal as well as dendritic arborization in mouse cortical neurons.

References

    1. Abel T, Nguyen PV. Regulation of hippocampus-dependent memory by cyclic AMP-dependent protein kinase. Prog Brain Res. 2008;169:97–115. - PMC - PubMed
    1. Abramoff MD, Magelhaes PJ, Ram SJ. Image processing with ImageJ. Biophotonics Int. 2004;11:36–42.
    1. Allen JA, Halverson-Tamboli RA, Rasenick MM. Lipid raft microdomains and neurotransmitter signalling. Nat Rev Neurosci. 2007;8:128–140. - PubMed
    1. Allinquant B, Hantraye P, Mailleux P, Moya K, Bouillot C, Prochiantz A. Downregulation of amyloid precursor protein inhibits neurite outgrowth in vitro. J Cell Biol. 1995;128:919–927. - PMC - PubMed
    1. Ando K, Oishi M, Takeda S, Iijima K, Isohara T, Nairn AC, Kirino Y, Greengard P, Suzuki T. Role of phosphorylation of Alzheimer's amyloid precursor protein during neuronal differentiation. J Neurosci. 1999;19:4421–4427. - PMC - PubMed

Publication types

MeSH terms

Substances

LinkOut - more resources