Comparative Study
. 2012 Feb 1;32(5):1771-83.
doi: 10.1523/JNEUROSCI.5500-11.2012.

Generation of multiple classes of V0 neurons in zebrafish spinal cord: progenitor heterogeneity and temporal control of neuronal diversity

Affiliations
Comparative Study

Generation of multiple classes of V0 neurons in zebrafish spinal cord: progenitor heterogeneity and temporal control of neuronal diversity

Chie Satou et al. J Neurosci. .

Abstract

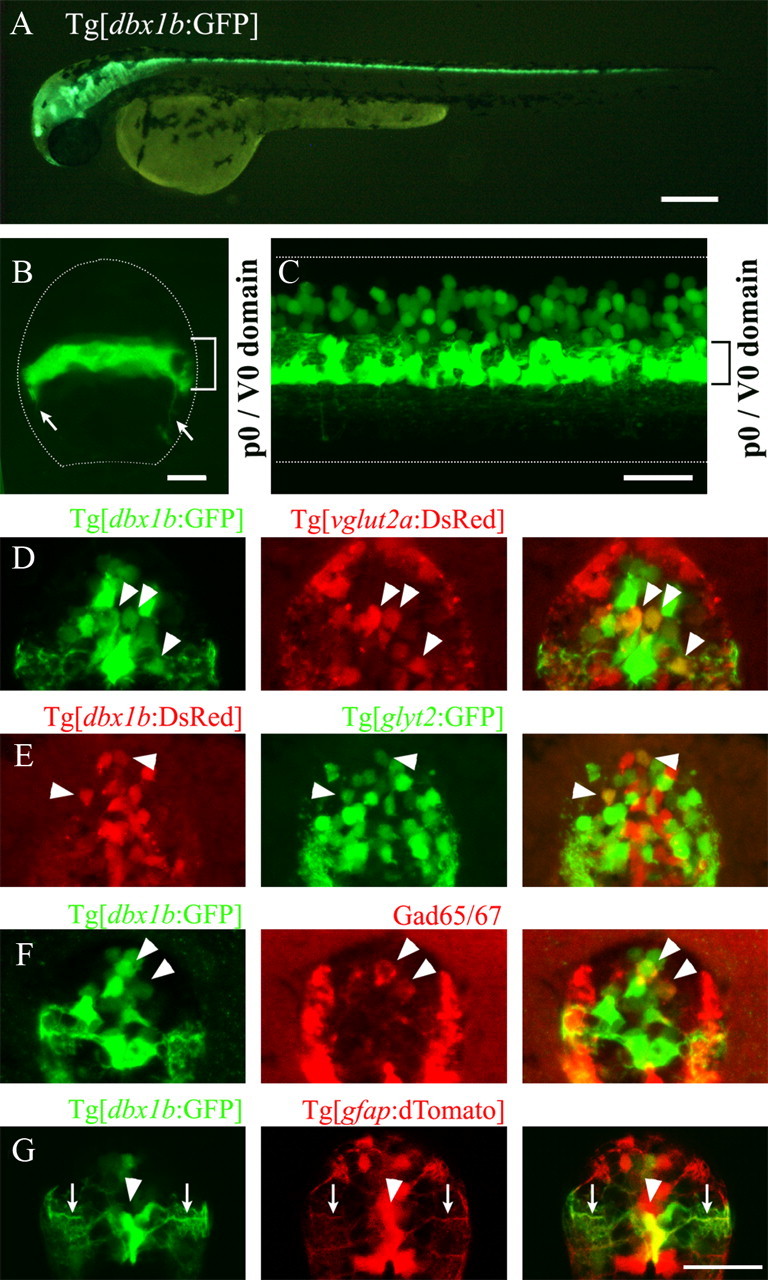
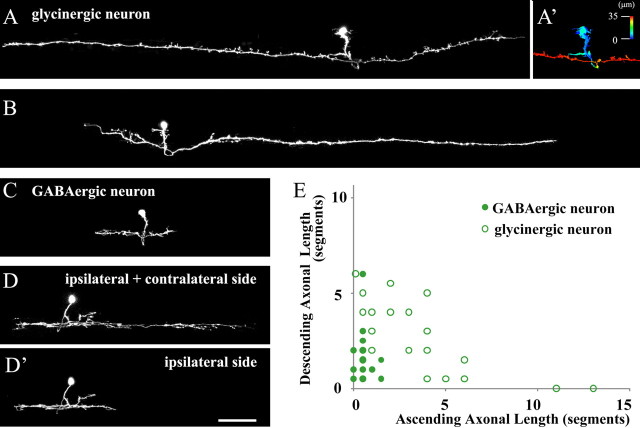
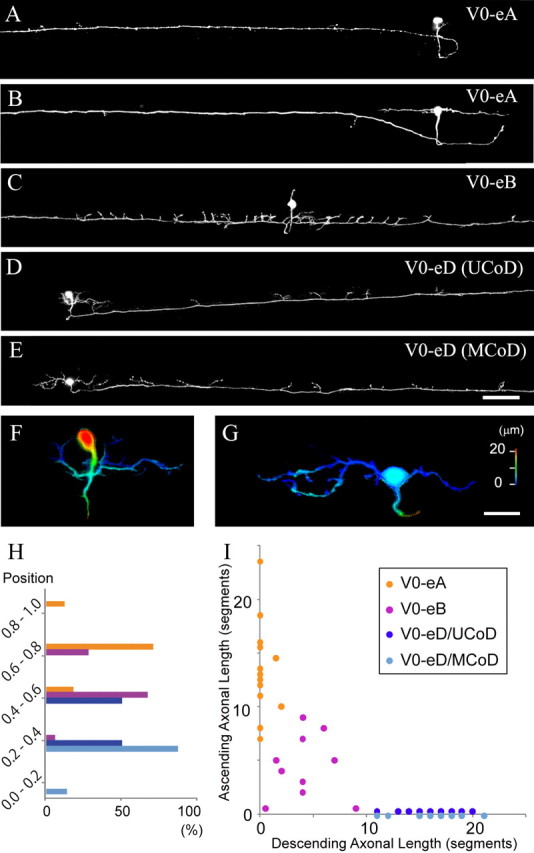
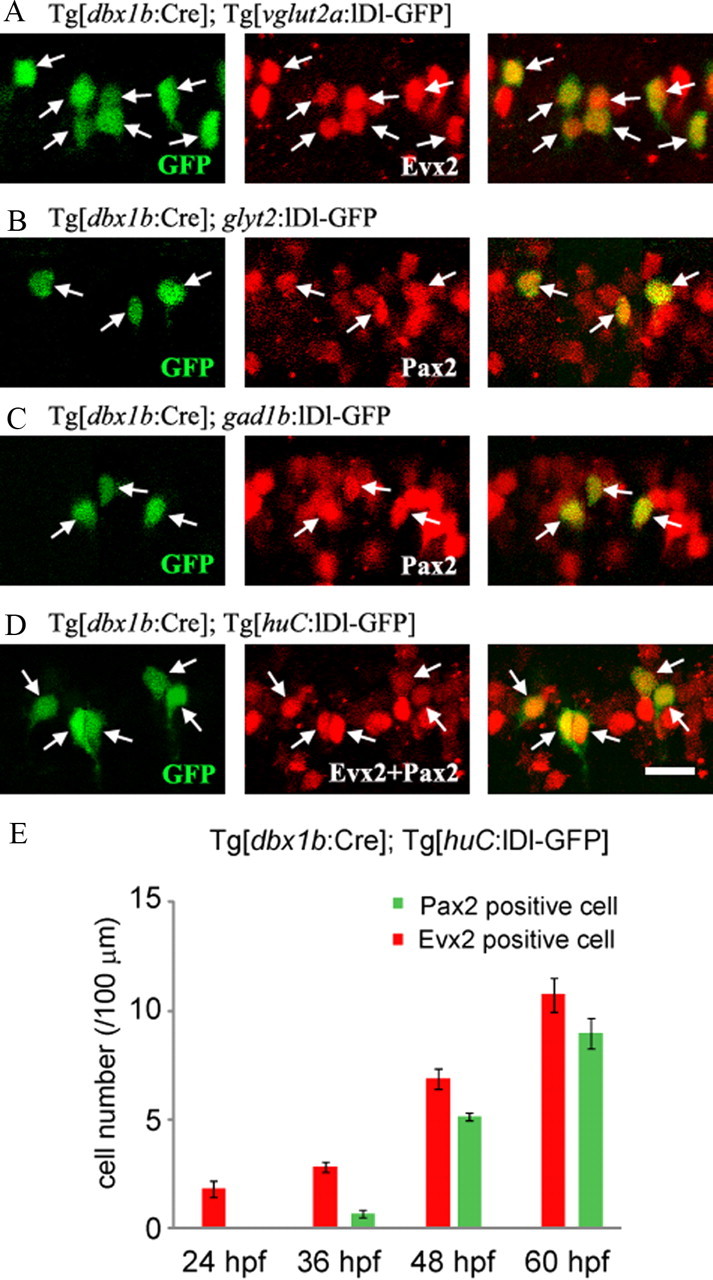
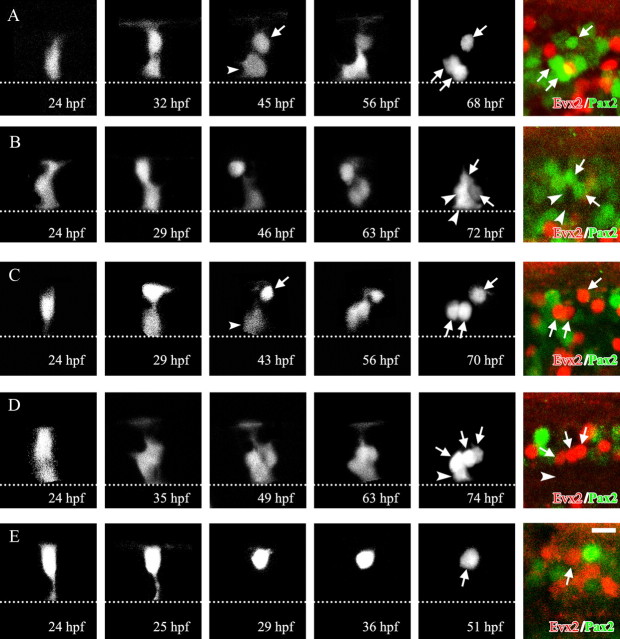
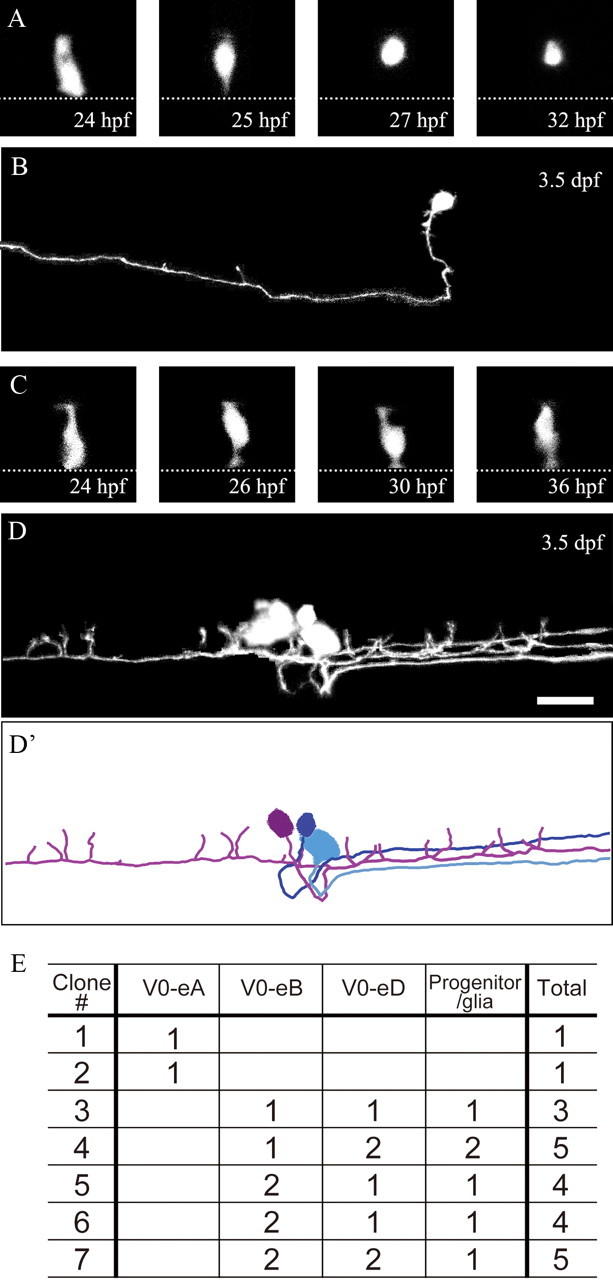
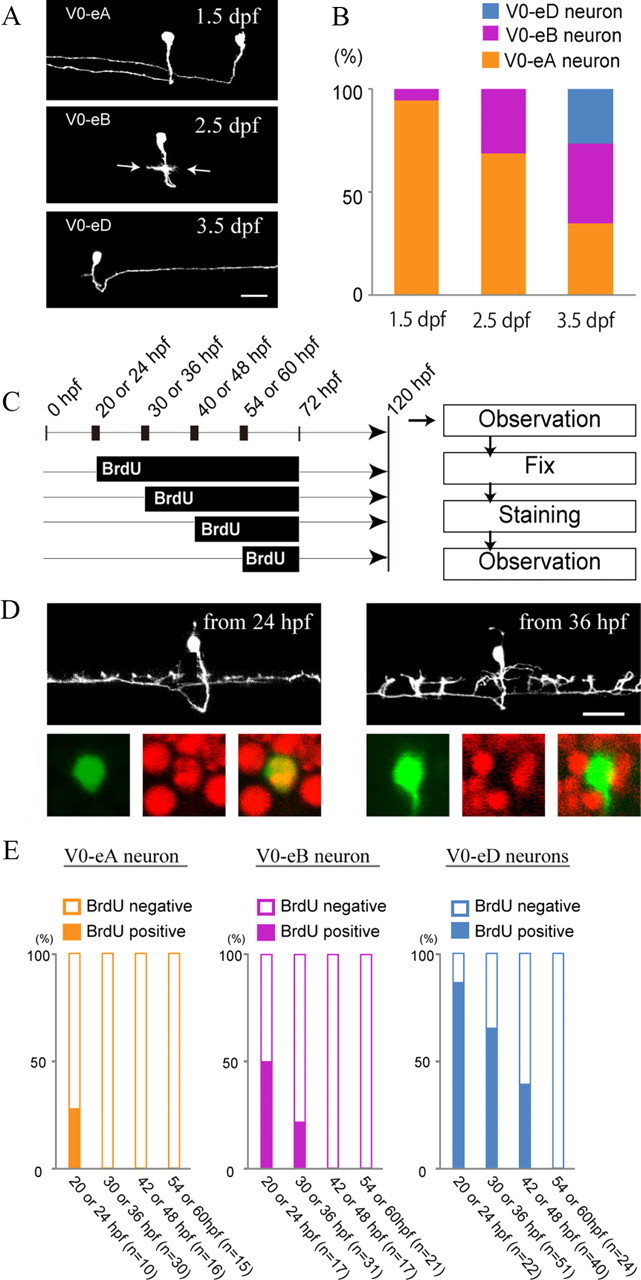
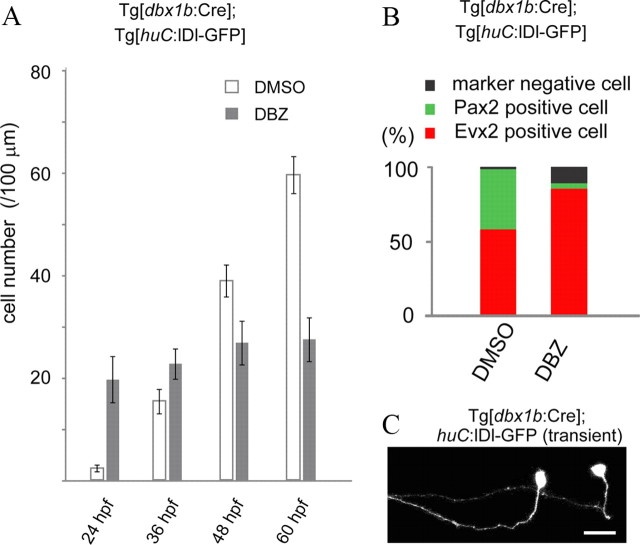
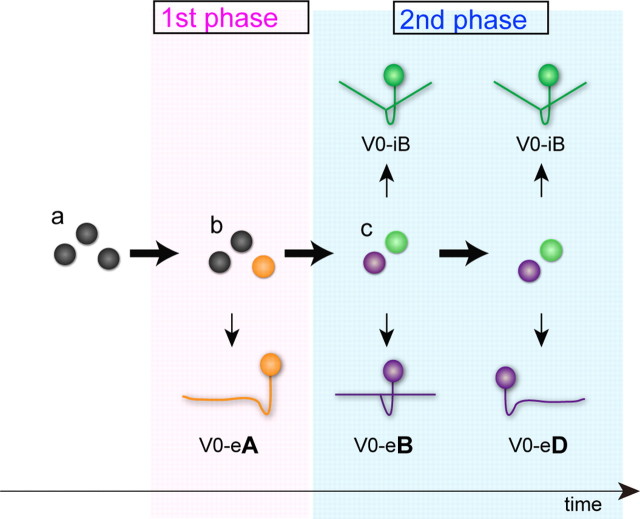
The developing spinal cord is subdivided into distinct progenitor domains, each of which gives rise to different types of neurons. However, the developmental mechanisms responsible for generating neuronal diversity within a domain are not well understood. Here, we have studied zebrafish V0 neurons, those that derive from the p0 progenitor domain, to address this question. We find that all V0 neurons have commissural axons, but they can be divided into excitatory and inhibitory classes. V0 excitatory neurons (V0-e) can be further categorized into three groups based on their axonal trajectories; V0-eA (ascending), V0-eB (bifurcating), and V0-eD (descending) neurons. By using time-lapse imaging of p0 progenitors and their progeny, we show that inhibitory and excitatory neurons are produced from different progenitors. We also demonstrate that V0-eA neurons are produced from distinct progenitors, while V0-eB and V0-eD neurons are produced from common progenitors. We then use birth-date analysis to reveal that V0-eA, V0-eB, and V0-eD neurons arise in this order. By perturbing Notch signaling and accelerating neuronal differentiation, we predictably alter the generation of early born V0-e neurons at the expense of later born ones. These results suggest that multiple types of V0 neurons are produced by two distinct mechanisms; from heterogeneous p0 progenitors and from the same p0 progenitor, but in a time-dependent manner.


Figures

Figure 1.
Figure 1.
Visualization of p0/V0 cells and neurotransmitter properties of V0 neurons. A, Tg[dbx1b:GFP] transgenic fish at 2.5 dpf. B, Cross section of the spinal cord of a Tg[dbx1b:GFP] transgenic fish at 36 hpf. A stacked image of confocal optical sections. Arrows indicate axons from GFP-expressing neurons. C, Lateral view of the spinal cord of a 2.5 dpf embryo. A stacked image of confocal optical sections. D–G, Cross sections were observed using confocal microscopy (stacked images). D, Compound transgenic fish of Tg[dbx1b:GFP] and Tg[vglut2a:DsRed] at 2.5 dpf. Arrowheads indicate cells that are dually positive for GFP and DsRed. E, Compound transgenic fish of Tg[dbx1b:DsRed] and Tg[glyt2:GFP] at 2.5 dpf. Arrowheads indicate cells that are dually positive for GFP and DsRed. F, Immunostaining with GAD65/67 in Tg[dbx1b:GFP] at 2.5 dpf. Arrowheads indicate cells that are dually positive for GFP and GAD65/67. G, Compound transgenic fish of Tg[dbx1b:GFP] and Tg[gfap:dTomato] at 5.5 dpf. An arrowhead indicates cells that are dually positive for GFP and dTomato. Arrows indicate GFP/dTomato-positive fiber-like processes extending outwards toward the pial surface. Scale bars: A, 250 μm; B, 10 μm; C, 50 μm; D–G, 20 μm.
Figure 2.
Figure 2.
Morphological analysis of GFP-labeled V0 inhibitory neurons. A–D, Fish in which a small number of V0 inhibitory neurons expressed GFP were obtained by injecting either the glyt2:loxP-DsRed-loxP-GFP (glyt2:lDl-GFP) or gad1b:lDl-GFP DNA constructs into Tg[dbx1b:Cre] transgenic fish. Images (at 5–5.5 dpf) were made from confocal optical sections. A, B, Two examples of V0 glycinergic neurons. A′, Depth-code image of A, showing that the axon crosses midline, and projects to the contralateral side. C, D, D′, Two examples of V0 GABAergic neurons. D and D′ are the same neuron. In D′, optical sections for only the ipsilateral side are stacked. E, Axonal length of GFP-labeled V0 glycinergic and GABAergic neurons (V0-iBs). The scale of the x and y axes is body segments. Scale bar, 100 μm.
Figure 3.
Figure 3.
Morphological analysis of GFP-labeled V0 excitatory neurons. A–G, Fish in which a small number of V0 excitatory neurons expressed GFP were obtained by injecting the vglut2a:lDl-GFP DNA construct into Tg[dbx1b:Cre] transgenic fish. Images (at 5–5.5 dpf) were made from confocal optical sections. A, B, Two examples of V0-eA (excitatory and ascending) neurons. C, An example of V0-eB (excitatory and bifurcating) neurons. D, An example of a unipolar type V0-eD (excitatory and descending) neuron. The morphological features match previously identified UCoD neurons. E, An example of a multipolar type V0-eD neuron. The morphological features match previously identified MCoD neurons. F, Depth-code view of D. The unipolar soma is located in the medial region of the spinal cord, while dendrites, which come off from the primary process are located superficially. G, Depth-code view of E. The soma and dendrites, which come off from the soma, are both located superficially. H, Location of somata of V0-eA, V0-eB, V0-eD (UCoD), and V0-eD (MCoD) neurons along the dorsoventral axis. The dorsal edge of the spinal cord is assigned as 1, while the ventral edge is assigned as 0. I, Axonal length of GFP-labeled V0-eA, V0-eB, V0-eD (UCoD), and V0-eD (MCoD) neurons. The scale of the x and y axes is body segments. Scale bars: A–E, 100 μm; F, G, 20 μm.
Figure 4.
Figure 4.
Evx2 and Pax2 expression in V0 neurons, and the timing of V0 neurogenesis. A–D, All are stacked images made from confocal optical sections. Red channels are Cy5 images. A, V0 excitatory neurons are labeled by GFP in compound transgenic fish of Tg[dbx1b:Cre] and Tg[vglut2a:lDl-GFP]. All the GFP-positive cells are positive for Evx2 (at arrows). B, V0 glycinergic neurons are labeled by GFP by injecting glyt2:lDl-GFP DNA into a Tg[dbx1b:Cre] transgenic embryo. All the GFP-positive cells are positive for Pax2 (at arrows). C, V0 GABAergic neurons are labeled by GFP by injecting gad1b:lDl-GFP DNA into a Tg[dbx1b:Cre] transgenic embryo. All the GFP-positive cells are positive for Pax2 (at arrows). D, V0 neurons are labeled by GFP in compound transgenic fish of Tg[dbx1b:Cre] and Tg[huC:lDl-GFP]. All the GFP-positive cells are positive for the combination of Evx2 and Pax2 (at arrows). E, Timing of appearance of Evx2- and Pax2-positive V0 neurons. V0 neurons were a broadly labeled by GFP in compound transgenic fish of Tg[dbx1b:Cre] and Tg[huC:lDl-GFP]. Numbers of Evx2-positive GFP cells and Pax2-positive cells were counted at 24, 36, 48, and 60 hpf. Evx2-expressing cells (V0 excitatory neurons) arose earlier than Pax2-expressing cells (V0 inhibitory neurons). Scale bar, 20 μm.
Figure 5.
Figure 5.
Time-lapse imaging of p0 progenitors and their progeny. hoxa9a:Cre DNA was injected into32-cell or 64-cell stage embryos of Tg[dbx1b:lDl-GFP] transgenic fish. Embryos having isolated GFP-labeled p0 progenitors were selected, and monitored by time-lapse imaging. All time-lapse images (black and white images) are stacked images (dorsal views) made from confocal optical sections. The right-most color panels show immunostaining with Evx2 (red) and Pax2 (green). These are montage images made from several confocal optical sections (the locations of GFP cells are highly three-dimensional, and thus, montages were generated using several optical sections for clear presentation). The dotted line in each panel shows the midline. A, The p0 progenitor produced three Pax2-positive cells (arrows in the right-most two panels). The first division of the progenitor appears to be an asymmetric one. The cell marked by the arrow in the middle panel is likely to be a postmitotic neuron (corresponds to the lateral-most Pax2 cell in the right-most panel), while the cell marked by the arrowhead is likely to be a progenitor; the cell divided once to generate the other two Pax2 cells. B, The p0 progenitor produced two Pax2-positive cells (arrows in the right-most two panels) and two marker-negative cells (arrowheads). C, The p0 progenitor produced three Evx2-positive cells (arrows in the right-most two panels). The first division of the progenitor appears to be an asymmetric one. The cell marked by the arrow in the middle panel is likely to be a postmitotic neuron (corresponds to the lateral-most Evx2 cell in the right-most panel), while the cell marked by the arrowhead is likely to be a progenitor; the cell divided once to generate the other two Evx2 cells. D, The p0 progenitor produced three Evx2-positive cells (arrows in the right-most two panels) and one marker-negative cell (arrowhead). E, The p0 progenitor directly differentiated into one Evx2-positive cell (arrows in the right-most two panels). Scale bar, 10 μm.
Figure 6.
Figure 6.
Time-lapse imaging of p0 progenitors and their progeny. After time-lapse imaging (A and C; dorsal views), animals were left to grow until 3.5 dpf, when the final images (B and D; lateral views) were taken. hoxa9a:Cre DNA was injected into 32-cell or 64-cell stage embryos of Tg[dbx1b:lDl-GFP] transgenic fish. Embryos having GFP-labeled p0 progenitors in isolation were selected, and monitored by time-lapse imaging. All pictures (black and white images) are stacked images made from confocal optical sections. A, B, The p0 progenitor directly differentiated into one V0-eA neuron. C, D, D′, The p0 progenitor produced one V0-eB neuron, two V0-eD neurons, and one progenitor or glial cell. D′ shows a camera-lucida image of D. Only neurons are traced (the progenitor/glia is not traced). E, Summary of lineage analysis. Scale bar, 20 μm.
Figure 7.
Figure 7.
Temporal order of V0 excitatory neurogenesis. In all the experiments, fish in which a small number of V0 excitatory neurons expressed GFP were obtained by injecting the vglut2a:lDl-GFP DNA construct into Tg[dbx1b:Cre] transgenic fish. A, Examples of three different time points. Top, 1.5 dpf. Two V0-eA neurons are labeled. Middle, 2.5 dpf. A V0-eB neuron is labeled (arrows indicate growing bifurcating axon). Bottom, A V0-eD neuron is labeled. B, Observation frequency of three classes of V0 excitatory neurons at three different time points. C, Schematics of BrdU incorporation experiments. BrdU was applied at a given time point, and embryos were incubated in the presence of BrdU until 72 hpf. Then, animals were moved to BrdU-free solution. At 120 hpf (5 dpf), neuronal morphology was examined. The animals were then processed for BrdU immunohistochemistry. D, Examples of V0-eB neurons. In each panel, the top images shows a stack of images from the living fish at 5 dpf, while the bottom three show images after BrdU immunohistochemistry. The GFP images are in green and the BrdU images are in red. Left, BrdU was applied at 24 hpf in this animal. The cell is positive for BrdU. Right, BrdU was applied at 36 hpf in this animal. The cell is negative for BrdU. E, Summary of BrdU incorporation experiments. Percentage of BrdU-positive and -negative cells for each cell type at a given time point of BrdU application is indicated. Scale bar, 20 μm.
Figure 8.
Figure 8.
Acceleration of neurogenesis by reducing Notch signaling results in overproduction of V0-eA neurons. In A and B, V0 neurons were broadly labeled by GFP in compound transgenic fish of Tg[dbx1b:Cre] and Tg[huC:lDl-GFP]. A, Numbers of GFP-labeled V0 neurons in control (DMSO-treated) and DBZ-treated embryos at different developmental time points. B, Percentage of Pax2- and Evx2-positive cells among GFP-labeled V0 neurons at 48 hpf. C, V0 neurons were stochastically labeled with GFP by injecting the huC:lDl-GFP construct into a Tg[dbx1b:Cre] transgenic embryo. The embryo was treated with DBZ. The two neurons shown have V0-eA like morphology. Scale bar, 20 μm.
Figure 9.
Figure 9.
A proposed model of V0 neuron differentiation. In this model, V0 neurogenesis is roughly subdivided into two phases: a first phase and a second phase. At the beginning, the model assumes that p0 progenitors are homogeneous populations (A). In the first phase, distinct, nonproliferating progenitors for V0-eA neurons are selected from the p0 progenitor pool (B). The selected progenitors then directly differentiate into V0-eA neurons without any further divisions. In the second phase, p0 progenitors are subdivided into two types: progenitors for V0 inhibitory neurons and those for V0 excitatory neurons (C). In the early stage of the second phase, progenitors for V0 excitatory neurons preferentially generate V0-eB neurons. In the late stage of the second phase, the same progenitors, after producing V0-eB neurons, preferentially produce V0-eD neurons.

References

    1. Aizawa H, Goto M, Sato T, Okamoto H. Temporally regulated asymmetric neurogenesis causes left-right difference in the zebrafish habenular structures. Dev Cell. 2007;12:87–98. - PubMed
    1. Alvarez FJ, Jonas PC, Sapir T, Hartley R, Berrocal MC, Geiman EJ, Todd AJ, Goulding M. Postnatal phenotype and localization of spinal cord V1 derived interneurons. J Comp Neurol. 2005;493:177–192. - PMC - PubMed
    1. Bernardos RL, Raymond PA. GFAP transgenic zebrafish. Gene Expr Patterns. 2006;6:1007–1013. - PubMed
    1. Bossing T, Udolph G, Doe CQ, Technau GM. The embryonic central nervous system lineages of Drosophila melanogaster. I. Neuroblast lineages derived from the ventral half of the neuroectoderm. Dev Biol. 1996;179:41–64. - PubMed
    1. Bouvier J, Thoby-Brisson M, Renier N, Dubreuil V, Ericson J, Champagnat J, Pierani A, Chédotal A, Fortin G. Hindbrain interneurons and axon guidance signaling critical for breathing. Nat Neurosci. 2010;13:1066–1074. - PubMed

Publication types

LinkOut - more resources