

Comparative Study
doi: 10.1523/JNEUROSCI.5181-11.2012.
Independent vesicle pools underlie different modes of release during neuronal development
Affiliations
- PMID: 22302825
- PMCID: PMC6703344
- DOI: 10.1523/JNEUROSCI.5181-11.2012
Item in Clipboard
Comparative Study
Independent vesicle pools underlie different modes of release during neuronal development
J Neurosci.
.
Abstract
Mature presynaptic terminals release neurotransmitter both in response to activity and spontaneously. We found that axons of rat hippocampal neurons initially show very high levels of exclusively spontaneous release, which progressively switches over to the mature phenotype during synapse formation. These two modes of vesicle cycling derive from distinct pools throughout development and the initiation of activity-dependent release was independent of postsynaptic contacts, suggesting it is an autonomous presynaptic event.
Figures

A developmental switch in vesicle release modes. a, Schematic and fluorescence images: biosyn labeling of activity-dependent (dep) vesicle cycling (top, red) shows this progressively increases during development while spontaneous (spon) cycling (bottom, red) shows a corresponding decrease. Surface (surf) VAMP2 is labeled in green to identify release sites. b, Plot of fluorescence intensities confirms this switch (n = 9–19 cells per condition/time point). Error bars represent SEM.
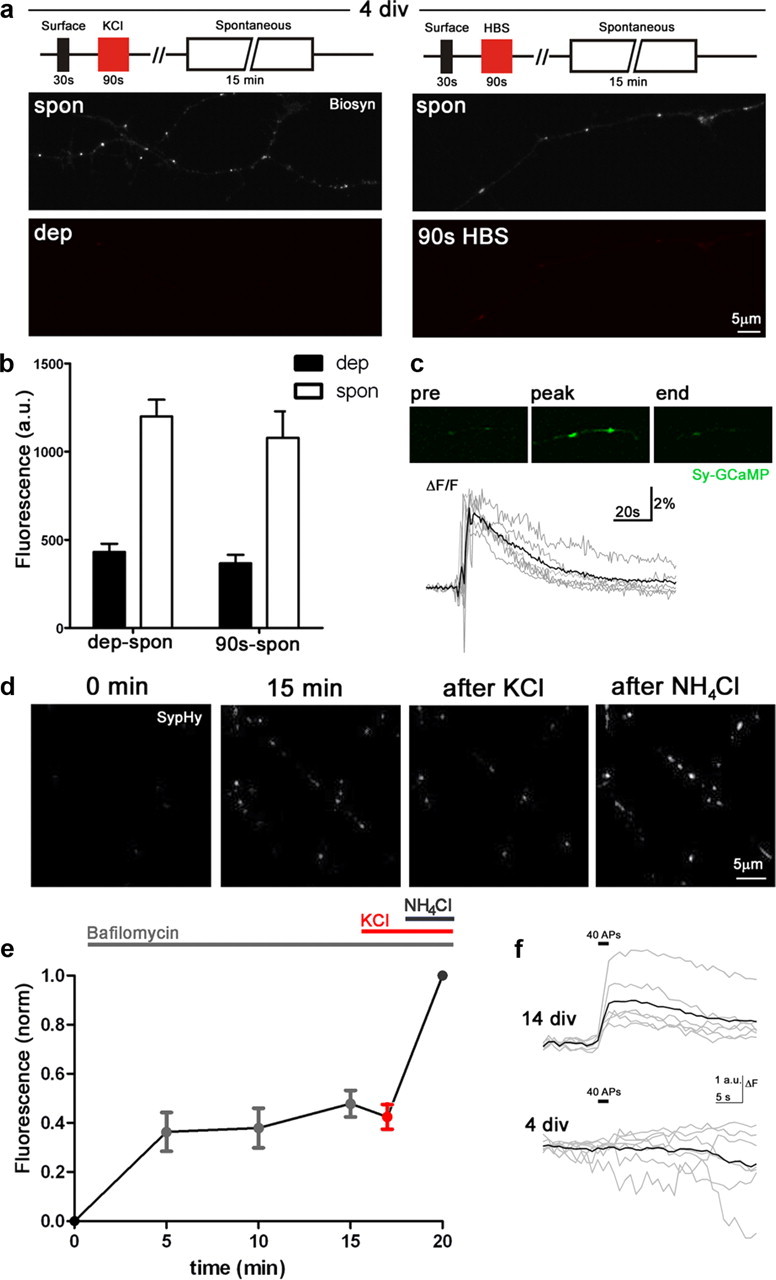
Evoked release is absent in young neurons. a, b, Schematic and fluorescence images (biosyn) to compare levels of cycling in 90 s at 4 DIV with or without 60 mm KCl reveal no differences between the two groups (n = 10–15). c, Calcium transient in response to KCl in neurons expressing synaptophysin-GCaMP2 (n = 6; gray, individual traces; black, mean). d, e, Neurons expressing SypHy in Bafilomycin show no further increase in fluorescence following high KCl treatment (n = 5). Fluorescence intensities were normalized to total vesicle pool size as revealed by NH4Cl unquenching. f, Stimulation with 40 action potentials at 20 Hz results in exocytotic response at 14 DIV (n = 6) but not at 4 DIV (n = 7). dep, activity-dependent; spon, spontaneous. Error bars represent SEM, n represents number of cells.

Evoked and spontaneous release derive from independent pools throughout development. a, Schematic of protocol used to label sequential pools, controlling for the 90 s high KCl incubation in each case. b, Graphs showing fluorescence intensities for the evoked (strep555) and spontaneous (strep647) vesicle pools at each developmental time point; labeling sequence indicated beneath columns, data used for PSI calculation indicated (n = 24–37 cells/time point). c, PSI plots for evoked (dep) and spontaneous (spon) pools. PSI values lie close to 1.0 (1 = separate, 0 = mixed) for all developmental time points. Controls (dep-dep or spon-spon) are shown in gray. d, Schematic to show labeling of evoked and surface pools with αSyt1-cypHer and subsequent destaining with field stimulation of 600 APs at 20 Hz. e, Fluorescence images before, during, and after stimulation (stim) show quenching of labeled puncta during stimulation followed by recovery. f, Mean fluorescence responses show very similar kinetics for both the evoked (n = 5) and surface (n = 5) pools. Error bars represent SEM.

Induction of activity-dependent cycling is not dependent on postsynaptic structure or axodendritic contact. a, Colabeling of the evoked pool (dep; red) and PSD-95 (green) at 14 DIV. Right, Enlargement of the boxed region showing colocalization of staining. b, Plot of fluorescence intensity of PSD-95 staining as a function of the normalized fluorescence of the evoked pool (Fdep; n = 244 synapses, 11 cells). Individual synapses are in gray and the binned means (bin size = 10) in black, best linear fit line (red) shows significant correlation. c, d, As in a and b, respectively, but for 10 DIV, no correlation seen (n = 475 synapses, 12 cells). e, At 7 DIV, while many sites of evoked release (red puncta) perfectly abut PSD-95 puncta (yellow arrows), others show no adjacent PSD-95 staining (white arrowheads), enlarged at right. f, At 6 DIV, many sites of evoked release (red puncta) do not have any nearby neuronal processes. Error bars represent SEM.
References
Publication types
MeSH terms
Grants and funding
LinkOut - more resources
Full Text Sources
Other Literature Sources