. 2012 Feb 1;26(3):259-70.
doi: 10.1101/gad.180406.111.

Dietary obesity-associated Hif1α activation in adipocytes restricts fatty acid oxidation and energy expenditure via suppression of the Sirt2-NAD+ system

Affiliations

Dietary obesity-associated Hif1α activation in adipocytes restricts fatty acid oxidation and energy expenditure via suppression of the Sirt2-NAD+ system

Jaya Krishnan et al. Genes Dev. .

Abstract

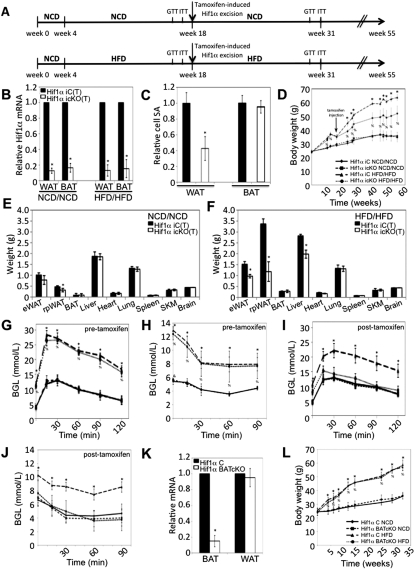
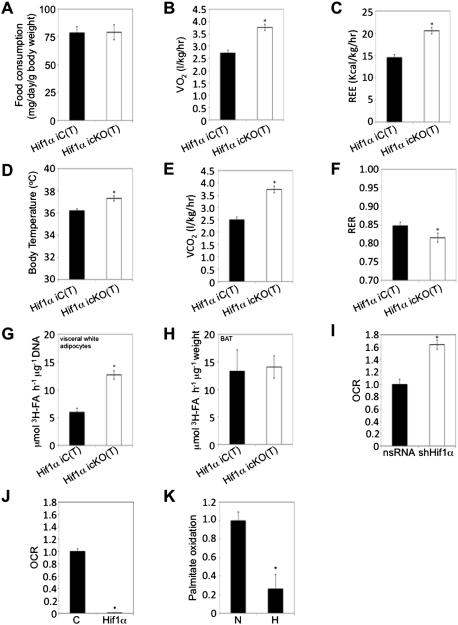
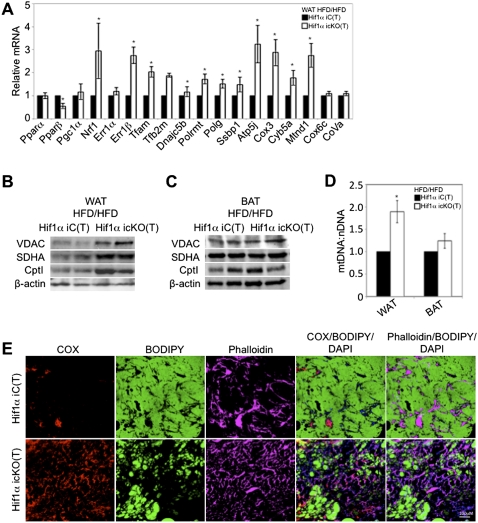
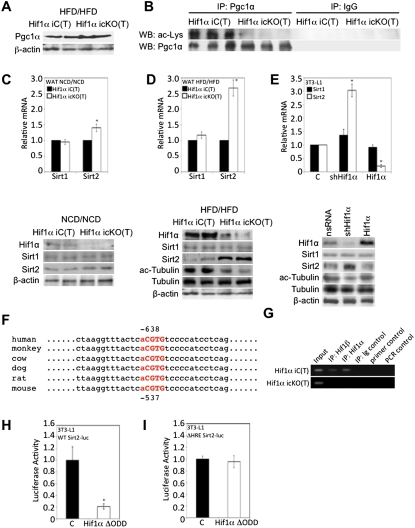
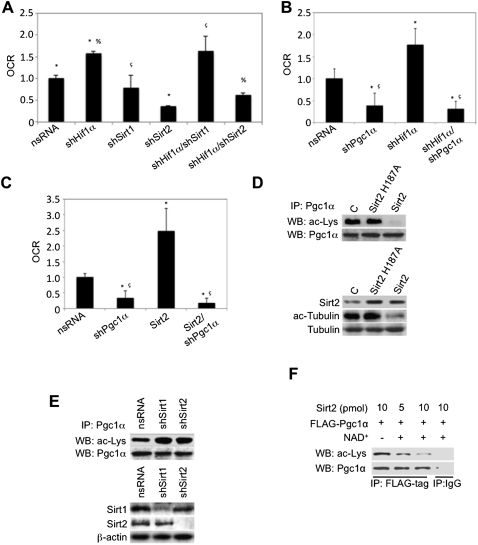
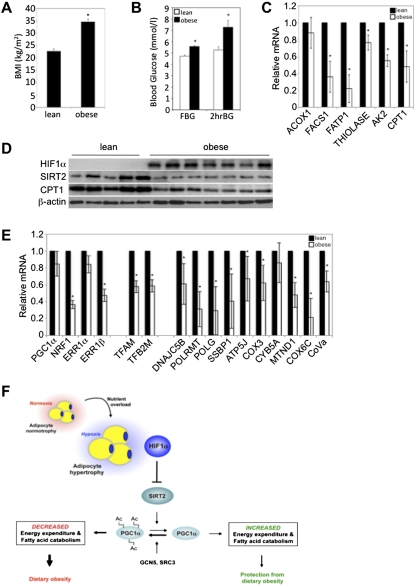
Dietary obesity is a major factor in the development of type 2 diabetes and is associated with intra-adipose tissue hypoxia and activation of hypoxia-inducible factor 1α (HIF1α). Here we report that, in mice, Hif1α activation in visceral white adipocytes is critical to maintain dietary obesity and associated pathologies, including glucose intolerance, insulin resistance, and cardiomyopathy. This function of Hif1α is linked to its capacity to suppress β-oxidation, in part, through transcriptional repression of sirtuin 2 (Sirt2) NAD(+)-dependent deacetylase. Reduced Sirt2 function directly translates into diminished deacetylation of PPARγ coactivator 1α (Pgc1α) and expression of β-oxidation and mitochondrial genes. Importantly, visceral adipose tissue from human obese subjects is characterized by high levels of HIF1α and low levels of SIRT2. Thus, by negatively regulating the Sirt2-Pgc1α regulatory axis, Hif1α negates adipocyte-intrinsic pathways of fatty acid catabolism, thereby creating a metabolic state supporting the development of obesity.


Figures

Figure 1.
Figure 1.
Temporal Hif1α inactivation attenuates adipose tissue expansion and protects from obesity-associated pathologies. (A) Schematic representation of the NCD/NCD (top panel) and HFD/HFD (bottom panel) protocols. All Hif1α iC and Hif1α icKO mice were initially maintained on a NCD to 4 wk of age, after which, Hif1α iC and Hif1α icKO littermates were randomly assigned to either the NCD/NCD or HFD/HFD protocol. NCD/NCD and HFD/HFD mice were maintained on a NCD or HFD for 14 wk thereafter, and tamoxifen was administered to both Hif1α iC and Hif1α icKO mice. The mice were maintained on either the NCD or HFD feeding protocol, respectively, following tamoxifen administration. GTT and ITT measurements were taken prior to Hif1α inactivation at weeks 16 and 17, respectively, and at weeks 14 and 15 post-Hif1α inactivation, respectively. (B) Visceral WAT and intrascapular BAT biopsies of tamoxifen-induced NCD/NCD- and HFD/HFD-maintained Hif1α iC(T) and Hif1α icKO(T) mice were assessed for Hif1α mRNA expression by qPCR. All values were normalized internally to 18S RNA expression and to the Hif1α iC(T) control, respectively. (*) P < 0.01 versus control, set at 1.0. Data are mean ± SEM of values from five mice per group. (C) Visceral WAT and BAT sections of Hif1α iC(T) and Hif1α icKO(T) mice maintained on the HFD/HFD protocol for 16 wk post-tamoxifen induction were stained with phalloidin to mark actin and the cell periphery and counterstained with DAPI. Confocal microscopic imaging was performed, and the cell surface area was quantified. Surface area measurements relative to Hif1α iC(T) sections are shown, which was set at 1.0. (*) P < 0.01. Data are mean ± SEM of values from five mice per group. (D) Hif1α iC(T) (n = 8 NCD/NCD; n = 10 HFD/HFD) and Hif1α icKO(T) (n = 7 NCD/NCD; n = 12 HFD/HFD) mice were assessed for changes in body weight at the indicated time points. (*) P < 0.05 versus Hif1α iC(T) HFD/HFD; (%) P < 0.05 versus Hif1α iC(T) NCD/NCD and Hif1α icKO(T) NCD/NCD. Data are mean ± SEM of values from each group. (E,F) Individual organs of Hif1α iC(T) (n = 8 NCD/NCD; n = 10 HFD/HFD) and Hif1α icKO(T) (n = 7 NCD/NCD; n = 12 HFD/HFD) mice were excised and weighed 16 wk post-tamoxifen induction. eWAT, rpWAT, and SKM indicate epididymal WAT, retroperitoneal WAT, and skeletal muscle, respectively. (*) P < 0.05 versus Hif1α iC(T). Data are mean ± SEM of values from each group. (G) GTT measurements of Hif1α iC(T) (n= 8 NCD/NCD; n = 10 HFD/HFD) and Hif1α icKO(T) (n = 7 NCD/NCD; n = 12 HFD/HFD) mice prior to tamoxifen-mediated Hif1α excision at week 16. (*,%) P < 0.05 versus Hif1α iC(T) NCD/NCD. Data are mean ± SEM of values from each group. (H) ITT measurements of Hif1α iC(T) (n = 8 NCD/NCD; n = 10 HFD/HFD) and Hif1α icKO(T) (n = 7 NCD/NCD; n = 12 HFD/HFD) mice prior to tamoxifen-mediated Hif1α excision at week 17. (*,%) P < 0.05 versus Hif1α iC(T) NCD/NCD. Data are mean ± SEM of values from each group. (I) GTT measurements of Hif1α iC(T) (n = 8 NCD/NCD; n = 10 HFD/HFD) and Hif1α icKO(T) (n = 7 NCD/NCD; n = 12 HFD/HFD) mice at 16 wk post-tamoxifen-mediated Hif1α excision. (*,%) P < 0.05 versus Hif1α iC(T) NCD/NCD. Data are mean ± SEM of values from each group. (J) ITT measurements of Hif1α iC(T) (n = 8 NCD/NCD; n = 10 HFD/HFD) and Hif1α icKO(T) (n = 7 NCD/NCD; n = 12 HFD/HFD) mice at 17 wk post-tamoxifen-mediated Hif1α excision. (*) P < 0.05 versus Hif1α iC(T) NCD/NCD. Data are mean ± SEM of values from each group. (K) Intrascapular BAT and visceral WAT biopsies of Hif1α C and Hif1α BATcKO mice maintained on either NCD or HFD were assessed for Hif1α mRNA expression by qPCR. All values were normalized internally to 18S RNA expression and to the Hif1α C control. (*) P < 0.01 versus control, set at 1.0. Data are mean ± SEM of values from seven mice per group. (L) Hif1α f/f (n = 10 NCD; n = 12 HFD) and Hif1α BATcKO (n = 8 NCD; n = 12 HFD) mice were maintained on either a NCD or HFD. Body weight measurements were taken at the indicated time points throughout the course of the protocol. (*,%) P < 0.05 versus NCD group. Data are mean ± SEM of values from each group.
Figure 2.
Figure 2.
Visceral adipose Hif1α inactivation promotes fatty acid β-oxidation and systemic energy expenditure. (A) Individually housed Hif1α iC(T) (n = 10) and Hif1α icKO(T) (n = 12) mice maintained on a HFD/HFD protocol were assessed for food intake over a period of 3 wk (between weeks 12–15 post-tamoxifen administration). Data are mean ± SEM of values from each group. (B–F) Hif1α iC(T) and Hif1α icKO(T) mice subjected to the HFD/HFD protocol were placed in metabolic cages at 15 wk post-Hif1α inactivation. Resting O2 consumption (B), energy expenditure (C), body temperature (D), CO2 expiration (E), and RER (F) measurements are shown. (*) P < 0.01 versus Hif1α iC(T) HFD/HFD. Data are mean ± SEM of values from six mice per group. (G,H) Primary visceral white adipocytes (G) and BAT explants (H) isolated from Hif1α iC(T) and Hif1α icKO(T) mice maintained on the HFD/HFD protocol were assessed for palmitate oxidation. (*) P < 0.05 veruss Hif1α iC(T) HFD/HFD. Data are mean ± SEM of values from four mice per group. (I,J) 3T3-L1-derived adipocytes were infected with shHif1α-encoding viruses or the corresponding nsRNA control (I), empty (mock, C), or Hif1α-encoding (J) virus and assessed for oleate-induced oxygen consumption rate (OCR) as a measure of fatty acid β-oxidation using the Seahorse Bioscience 24XF extracellular flux analyzer. (*) P < 0.01 compared with control, set at 1.0. Data are mean ± SEM of values from each group. (K) Differentiated 3T3-L1 adipocytes were cultured in normoxia (N, 20% O2) or hypoxia (H, 3% O2) and assessed for palmitate oxidation. (*) P < 0.01 compared with normoxia control (N), set at 1.0. Data are mean ± SEM of values from each group.
Figure 3.
Figure 3.
Hif1α inactivation in visceral WAT promotes Pgc1α target gene expression and mitochondrial biogenesis. (A) Gene expression profiling of visceral WAT of Hif1α iC(T) and Hif1α icKO(T) mice maintained on the HFD/HFD protocol for regulators FAO and mitochondrial biogenesis. All values were normalized internally to 18S RNA expression and to the Hif1α iC(T) control, respectively. (*) P < 0.01 compared with control, set at 1.0. Data are mean ± SEM of values from five mice per group. (B,C) Visceral WAT (B) and BAT (C) biopsies of Hif1α iC(T) and Hif1α icKO(T) maintained on the HFD/HFD protocol were probed for protein expression of VDAC, SDHA, and Cpt1. Sample loading was normalized to β-actin. (D) Quantification of mitochondrial DNA content relative to nuclear DNA content in visceral WAT and BAT. All values were normalized to the Hif1α iC(T) control, respectively. (*) P < 0.05 compared with control, set at 1.0. Data are mean ± SEM of values from four to five mice per group. (E) Visceral WAT sections of Hif1α iC(T) and Hif1α icKO(T) mice maintained on the HFD/HFD protocol were stained for the mitochondrial marker cytochrome oxidase (COX, red), BODIPY (green), phalloidin (pink), and DAPI (blue) and analyzed by immunofluorescence confocal microscopy.
Figure 4.
Figure 4.
Hif1α inactivation promotes Pgc1α deacetylation via Sirt2. (A) Visceral WAT of Hif1α iC(T) and Hif1α icKO(T) mice subjected to the HFD/HFD protocol were assessed for Pgc1α protein expression. β-Actin served as a loading control. (B) Endogenous Pgc1α was immunoprecipitated from HFD/HFD-maintained Hif1α iC(T) and Hif1α icKO(T) visceral WAT lysates and probed by immunoblotting for acetylated lysine and Pgc1α. IgG antibodies were used as negative controls. (C,D) Gene expression profiling of Hif1α iC(T) and Hif1α icKO(T) mice subjected to the NFD/NFD (D, top panel) or HFD/HFD (E, top panel) protocol for Sirt1 and Sirt2 mRNA. All values were normalized internally to 18S RNA expression and to the Hif1α iC(T) control, respectively. (*) P < 0.01 compared with control, set at 1.0. Data are mean ± SEM of values from four mice per group. Visceral WAT of Hif1α iC(T) and Hif1α icKO(T) mice subjected to the NCD/NCD (D, bottom panel) or HFD/HFD (E, bottom panel) protocol were assessed for Hif1α, Sirt1, and Sirt2 protein expression (C,D) and tubulin acetylation (D). β-Actin served as a loading control. (E) 3T3-L1-derived adipocytes were infected with nsRNA, shHif1α, or Hif1α virus and assessed for Sirt1 and Sirt2 mRNA levels (top panel) and protein expression of Hif1α, Sirt1, Sirt2, and tubulin acetylation (bottom panel), with β-actin as a loading control. All qPCR values were normalized internally to 18S RNA expression and to nsRNA values, respectively. (*) P < 0.01 compared with control, set at 1.0. Data are mean ± SEM of values from each group. (F) Sequence analysis of the human, monkey, cow, dog, rat, and mouse Sirt2 promoters showing conserved putative HREs (in bold and red). The core consensus HRE motif is capitalized. (G) Hif1α iC(T) and Hif1α icKO(T) WAT derived from mice subjected to the HFD/HFD protocol were assessed for interaction of Hif1α and Hif1β at the Sirt2 promoter by ChIP. DNA from the respective samples was immunoprecipitated with a Hif1α (IP:Hif1α)-specific and a Hif1β (IP:Hif1β)-specific antibody or with a control isotype-matched antibody (IP:Ig control). Primer control and PCR control refer to reactions performed in the absence of primers or in the absence of DNA input, respectively. (H,I) Sirt2 promoter activity in response to Hif1α was determined by transient cotransfection of wild-type (WT) (H) and HRE-mutated (ΔHRE) (I) Sirt2 promoter, respectively, fused to luciferase and with either an empty vector control or a Hif1α ΔODD expression construct. All transfections contained equal amounts of a β-galactosidase expression vector for normalization of luciferase activity. (*) P < 0.01 compared with control, set at 1.0. Data are mean ± SEM of values from each group.
Figure 5.
Figure 5.
Sirt2 promotes oxidative catabolism via Pgc1α deacetylation. (A) 3T3-L1-derived adipocytes were infected with empty nsRNA, shHif1α, shSirt1, shSirt2, or a combination thereof and assessed for oleate-induced oxygen consumption as a measure of fatty acid β-oxidation using the Seahorse Bioscience 24XF extracellular flux analyzer. The normalized OCR is shown. (*) P < 0.01 compared with control nsRNA, set at 1.0; (%) P < 0.01 compared with shHif1α; (ç) P < 0.01 compared with shSirt1. Data are mean ± SEM of values from each group. (B) 3T3-L1-derived adipocytes were infected with empty nsRNA, shPgc1α, shHif1α, or shHif1α/shPgc1α and assessed for oleate-induced oxygen consumption as a measure of fatty acid β-oxidation using the Seahorse Bioscience 24XF extracellular flux analyzer. The normalized OCR is shown. (*) P < 0.01 compared with control nsRNA, set at 1.0; (ç) P < 0.01 compared with shHif1α. Data are mean ± SEM of values from each group. (C) Lentivirus-mediated ectopic expression of Sirt2 was performed in 3T3-L1-derived adipocytes in the presence or absence of shPgc1α and assessed for oleate-induced oxygen consumption as a measure of fatty acid β-oxidation using the Seahorse Bioscience 24XF extracellular flux analyzer. The normalized OCR is shown. (*) P < 0.01 compared with control nsRNA, set at 1.0; (ç) P < 0.01 compared with Sirt2. Data are mean ± SEM of values from each group. (D, top panels) Ectopic lentiviral-mediated Sirt2 or Sirt2 H187A expression was performed in 293 cells, and lysates were immunoprecipitated with the Pgc1α antibody and probed for lysine acetylation and Pgc1α by immunoblotting. (Bottom panels) In parallel, lysates were probed for Sirt2 expression and tubulin acetylation by immunoblotting. (E, top panels) Lentiviral shRNA-mediated Sirt1 and Sirt2 knockdown was performed in 293 cells, and lysates were immunoprecipitated with the Pgc1α antibody and probed for lysine acetylation and Pgc1α by immunoblotting. (Bottom panels) In parallel, lysates were probed for Sirt1 and Sirt2 expression by immunoblotting. (F) Flag-tagged Pgc1α ectopically expressed in 293 cells was immunoprecipitated and incubated in the presence of varying amounts of purified Sirt2 protein in the presence or absence of NAD+ as indicated and probed by immunoblotting for acetylated lysine and Pgc1α. Immunoprecipitation with IgG serves as a negative control.
Figure 6.
Figure 6.
Sirt2 is down-regulated in human obesity. (A) Average BMI of subjects within the lean (n = 9) and obese (n = 9) groups, respectively. (*) P < 0.01 versus lean subjects. Data are mean ± SEM of values from each group. (B) Fasting (FBG) and 2-h oral GTT (2hrBG) blood glucose indices of the lean (n = 9) and obese (n = 9) groups are shown. (*) P < 0.05 versus lean subjects. Data are mean ± SEM of values from each group. (C) Gene expression profiling of visceral WAT biopsies of lean and obese subjects for components of FAO. All values were normalized internally to 18S RNA expression and to the lean samples, respectively. (*) P < 0.05 versus lean subjects. Data are mean ± SEM of values from the respective groups. (D) Visceral WAT biopsies of human lean or obese subjects were assessed for HIF1α, SIRT2, and CPT1 protein expression. β-Actin served as a loading control. (E) Gene expression profiling of visceral WAT biopsies of lean and obese subjects for regulators mitochondrial biogenesis and of mitochondrial complex and electron transport chain proteins. All values were normalized internally to 18S RNA expression and to the lean samples, respectively. (*) P < 0.05 versus lean subjects. Data are mean ± SEM of values from the respective groups. (F) Schematic representation of the transcriptional and enzymatic coregulation of SIRT2 by HIF1α. Nutrient overload-induced adipose expansion augments intra-adipose hypoxia, leading to adipocyte HIF1α accumulation. HIF1α represses SIRT2 transcription via interaction at a cross-species conserved HRE on the SIRT2 promoter. The repression of SIRT2 activity by HIF1α is predicted to support the maintenance of general control of amino acid synthesis, yeast, homolog-like 2 (GCN5/KAT2A)-mediated, and/or steroid receptor coactivator protein 3 (SRC3/NCOA3)-mediated Pgc1α hyperacetylation and its consequent inactivation, culminating in the maintenance of lipid anabolism and pathological adipose expansion. For additional details, see the text.

Similar articles

Cited by

References

    1. Black JC, Mosley A, Kitada T, Washburn M, Carey M 2008. The SIRT2 deacetylase regulates autoacetylation of p300. Mol Cell 32: 449–455 - PMC - PubMed
    1. Boudina S, Abel ED 2010. Diabetic cardiomyopathy, causes and effects. Rev Endocr Metab Disord 11: 31–39 - PMC - PubMed
    1. Buettner R, Parhofer KG, Woenckhaus M, Wrede CE, Kunz-Schughart LA, Scholmerich J, Bollheimer LC 2006. Defining high-fat-diet rat models: Metabolic and molecular effects of different fat types. J Mol Endocrinol 36: 485–501 - PubMed
    1. Cinti S 2009. Transdifferentiation properties of adipocytes in the adipose organ. Am J Physiol 297: E977–E986 doi: 10.1152/ajpendo.00183.2009 - PubMed
    1. Donohoe CL, Doyle SL, Reynolds JV 2011. Visceral adiposity, insulin resistance and cancer risk. Diabetol Metab Syndr 3: 12 doi: 10.1186/1758-5996-3-12 - PMC - PubMed

Publication types

MeSH terms