. 2012 Mar 30;287(14):11546-55.
doi: 10.1074/jbc.M111.315648. Epub 2012 Feb 2.

Interconnection of salt-induced hydrophobic compaction and secondary structure formation depends on solution conditions: revisiting early events of protein folding at single molecule resolution

Affiliations

Interconnection of salt-induced hydrophobic compaction and secondary structure formation depends on solution conditions: revisiting early events of protein folding at single molecule resolution

Shubhasis Haldar et al. J Biol Chem. .

Abstract

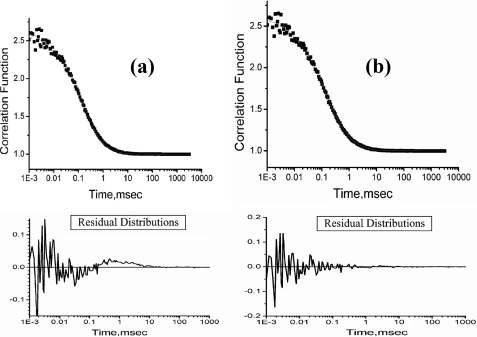
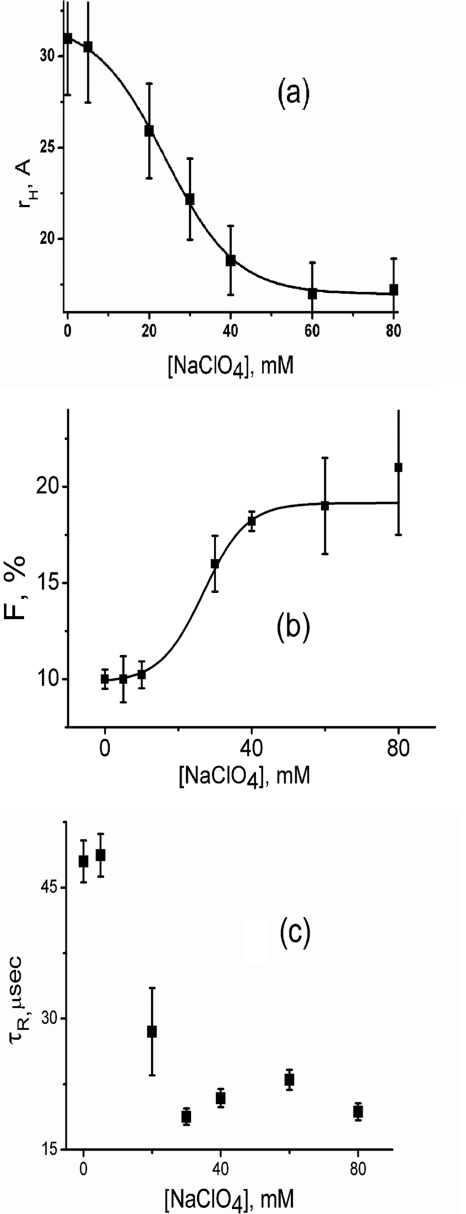
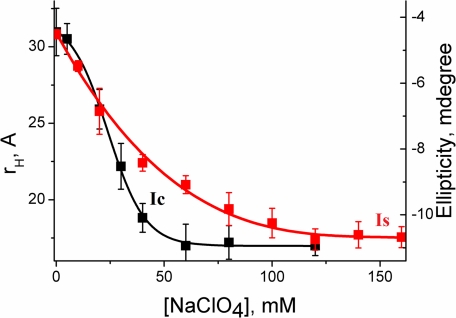
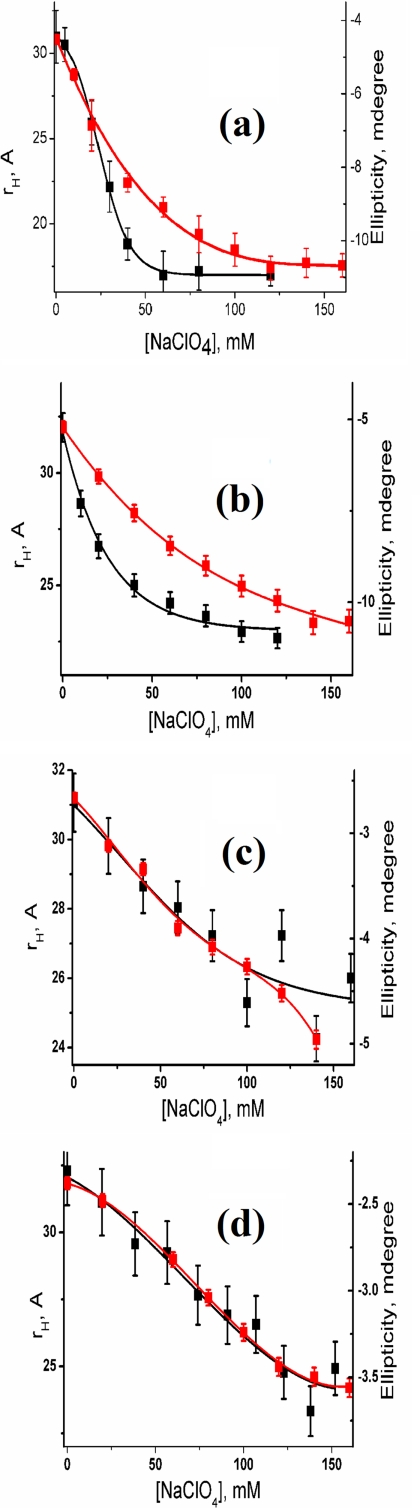
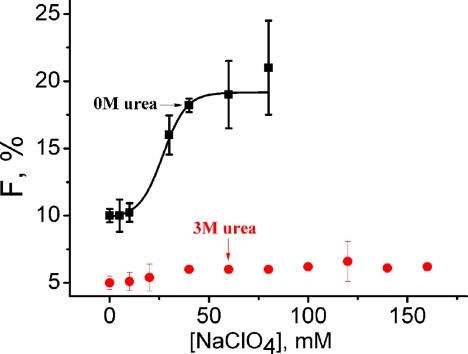
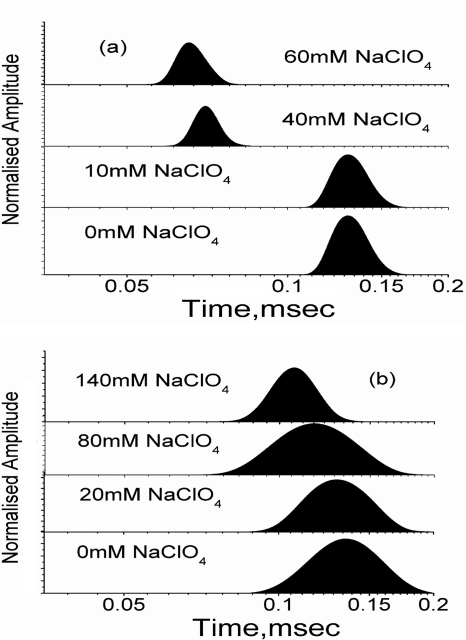
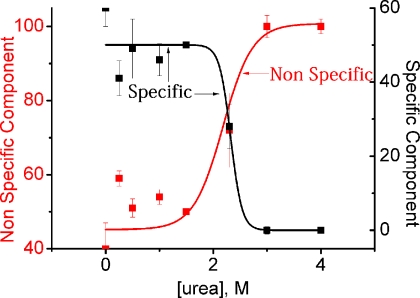
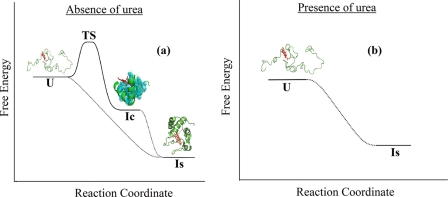
What happens in the early stage of protein folding remains an interesting unsolved problem. Rapid kinetics measurements with cytochrome c using submillisecond continuous flow mixing devices suggest simultaneous formation of a compact collapsed state and secondary structure. These data seem to indicate that collapse formation is guided by specific short and long range interactions (heteropolymer collapse). A contrasting interpretation also has been proposed, which suggests that the collapse formation is rapid, nonspecific, and a trivial solvent related compaction, which could as well be observed by a homopolymer (homopolymer collapse). We address this controversy using fluorescence correlation spectroscopy (FCS), which enables us to monitor the salt-induced compaction accompanying collapse formation and the associated time constant directly at single molecule resolution. In addition, we follow the formation of secondary structure using far UV CD. The data presented here suggest that both these models (homopolymer and heteropolymer) could be applicable depending on the solution conditions. For example, the formation of secondary structure and compact state is not simultaneous in aqueous buffer. In aqueous buffer, formation of the compact state occurs through a two-state co-operative transition following heteropolymer formalism, whereas secondary structure formation takes place gradually. In contrast, in the presence of urea, a compaction of the protein radius occurs gradually over an extended range of salt concentration following homopolymer formalism. The salt-induced compaction and the formation of secondary structure take place simultaneously in the presence of urea.


Figures

FIGURE 1.
FIGURE 1.
a, representative correlation function obtained by FCS experiments with on average a single cytochrome c-TMR molecule at pH 2. The fit of this data to Equation 1 yields non-random behavior of the residual distribution (shown at the bottom of the figure) suggesting that Equation 1 may not be appropriate. b, correlation function obtained with cytochrome c-TMR at pH 2 could be fit successfully to Equation 2. Residual distribution calculated using Equation 2 (shown at the bottom of the figure) is completely random, indicating the goodness of the fit.
FIGURE 2.
FIGURE 2.
The variation of rH (a), F (b), and τR (c) with sodium perchlorate concentrations at pH 2. These parameters have been calculated by fitting the correlation functions using Equation 2. The lines drawn through rH and F data show their fit to a two-state unfolding transition model. The data suggests the presence of a conformational fluctuation between equilibrium distributions of U (rH of 31 Å) and IC (rH of 18 Å) at pH 2. The presence of sodium perchlorate shifts the equilibrium toward IC. The equilibrium between U and IC could be defined successfully using a two-state transition hypothesis. The error bars shown in this and other figures have been calculated using at least three independent measurements.
FIGURE 3.
FIGURE 3.
The comparison between the formation of collapsed state (IC) and that of secondary structure (IS). The formation of IC has been monitored by rH using FCS data (black squares), whereas far UV CD at 222 nm (red squares) has been used to monitor the formation of IS. The data containing the variation of rH with sodium perchlorate concentration has been fit to a two-state unfolding transition as shown by the black line. The line through the CD data (red line), on the other hand, is for the presentation only and not a fit using a physically validated equation. All measurements have been carried out at pH 2.
FIGURE 4.
FIGURE 4.
Variation of rH (black) and ellipticity at 222 nm (red) with sodium perchlorate concentration in the presence of 0 m urea (a), 1 m urea (b), 3 m urea (c), and 4 m urea (d). At low urea concentration (0 and 1 m urea), the formation of IC and IS are not simultaneous. In the presence of high concentration of urea (3 and 4 m urea), however, IC and IS form simultaneously. The variation of rH with sodium perchlorate concentration in the absence of urea (a) could be fit successfully using a two-state unfolding transition. The data deviate from this model in the presence of urea and the drawn lines are only for presentation purposes (b–d).
FIGURE 5.
FIGURE 5.
The variation of amplitude of τR (F, %) of cytochrome c at pH 2 with sodium perchlorate concentration in the absence (black) and presence (red) of 3 m urea. A large increase in F with the salt concentration has been observed in the absence of urea, whereas no significant change is present in the presence of 3 m urea.
FIGURE 6.
FIGURE 6.
The variation of the maximum entropy profiles of cytochrome c-TMR with sodium perchlorate concentration in the absence (a) and presence (b) of 3 m urea at pH 2. In the absence of urea, the maximum entropy profiles shift sharply toward lower diffusion time as IC forms. This behavior of maximum entropy profiles is not consistent with the homopolymer collapse hypothesis. In the presence of urea, however, IC forms slowly and gradually over an extended range of sodium perchlorate concentration, as expected for a homopolymer collapse.
FIGURE 7.
FIGURE 7.
The variation in the percentage of nonspecific (red) and specific contributions (black) to the secondary structure with urea concentration. A percentage of nonspecific component increases and that of specific component decreases with urea concentration. It is important to note that these percentage calculations are based on total secondary structure change between the U and IS and the native state (N) is not considered.
FIGURE 8.
FIGURE 8.
A schematic diagram showing the sodium perchlorate induced formation of IC and IS in aqueous buffer (a) and in the presence (b) of 3 m urea. The unfolded extended conformer (U) does not have any secondary structure although the cofactor heme is bound to the protein. U has been found to be in rapid equilibrium with a compact conformer (IC) and the time constant of their interconversion is 50 μs. The addition of sodium perchlorate shifts the equilibrium toward IC, which is accompanied by a decrease in rH and an increase in F. The hydrophobic residues, which may be involved in the formation of IC, are shown by space-filling spheres. The cofactor heme, because it is hydrophobic, may also contribute toward the formation of IC. IC has been shown to contain partial secondary structure (presumably at the N and C-terminal helix regions). Sodium perchlorate induced formation of IC is a sharp cooperative transition with a defined transition state. The formation of the secondary structure (IS) takes place gradually over an extended range of sodium perchlorate concentration. This is an extended homopolymer-like transition and shown using dotted lines. The formation of the native protein is slow and is not shown. No rapid equilibrium exists between the extended (U) and any IC-like state in the presence of 3 m urea. A small extent of chain contraction (observed by the decrease in rH) and an increase in the secondary structure formation occur slowly and simultaneously in the presence of urea. The structure of IC (or IS) in the presence of urea is not defined, although these states are more compact than U and more extended than N (or IC observed without urea).
FIGURE 9.
FIGURE 9.
The calculated variation of the hydrodynamic radii of different proteins with the number of residues for the extended unfolded states in the good solvent (black) and the native states in the poor solvent (red). The rH values determined from the present FCS measurements at different solution conditions are also shown. These are unfolded state (black open circles), native state (black filled triangles), IC in the absence (red open squares) and presence of 1 m urea (red open circles), 3 m urea (black filled circles) and 4 m urea (red filled squares).

Similar articles

Cited by

References

    1. Eaton W. A., Thompson P. A., Chan C. K., Hage S. J., Hofrichter J. (1996) Fast events in protein folding. Structure 4, 1133–1139 - PubMed
    1. Hagen S. J., Hofrichter J., Szabo A., Eaton W. A. (1996) Diffusion-limited contact formation in unfolded cytochrome c: Estimating the maximum rate of protein folding. Proc. Natl. Acad. Sci. U.S.A. 93, 11615–11617 - PMC - PubMed
    1. Chattopadhyay K., Elson E. L., Frieden C. (2005) The kinetics of conformational fluctuations in an unfolded protein measured by fluorescence methods. Proc. Natl. Acad. Sci. U.S.A. 102, 2385–2389 - PMC - PubMed
    1. Chen H., Rhoades E., Butler J. S., Loh S. N., Webb W. W. (2007) Dynamics of equilibrium structural fluctuations of apomyoglobin measured by fluorescence correlation spectroscopy. Proc. Natl. Acad. Sci. U.S.A. 104, 10459–10464 - PMC - PubMed
    1. Akiyama S., Takahashi S., Ishimori K., Morishima I. (2000) Stepwise formation of α-helices during cytochrome c folding. Nat. Struct. Biol. 7, 514–520 - PubMed

Publication types

MeSH terms

LinkOut - more resources