

doi: 10.1199/tab.0011.
Epub 2002 Mar 27.
Molecular and developmental biology of inorganic nitrogen nutrition
- PMID: 22303192
- PMCID: PMC3243300
- DOI: 10.1199/tab.0011
Item in Clipboard
Molecular and developmental biology of inorganic nitrogen nutrition
Arabidopsis Book.
2002.
No abstract available
Figures

Nitrate assimilation pathway. NRT: nitrate transporters; NR: nitrate reductase; NiR; nitrite reductase.

Schematic diagram showing a split-root experiment. Figure was adapted from (Cerezo et al., 2001).

Schematic diagram showing the Moco synthesis pathway. Picture taken from (Mendel, 1997).

Possible mechanisms for high- and low-affinity NH4+ uptake by Arabidopsis roots. High-affinity NH4+ influx is thought to be catalysed by members of the AMT transporter family (e.g. AtAMT1.1) and is dependent on the H+ gradient generated by the plasma membrane H+-ATPase. The membrane proteins responsible for low-affinity NH4+ uptake are still unidentified but are likely to include K+ channels and transporters that do not discriminate against NH4+. Diffusion of the uncharged species NH3 across the plasma membrane is unlikely to contribute significantly to influx, but may be a major route for NH3/NH4+ efflux. See text for further discussion.

Phylogenetic tree for the Arabidopsis AMT transporters and selected members of the AMT/MEP family. The sequences were aligned using the CLUSTAL W program (Thompson et al., 1994) and the rooted tree constructed using DRAWGRAM (Felsenstein, 1993). The accession numbers for the AtAMT sequences are given in Table 3. The other sequences, with their accession numbers, are from Saccharomyces cerevisiae (ScMEP1, PIR:S46225; ScMEP2 PIR:S51089; ScMEP3 PIR:S69027), Schizosaccharomyces pombe (SpAMT1, PIR:T50244; SpAMT2, GB:CAB83006), Caenorhabditis elegans (CeAMT1, GB:P54145; CeAMT2, GB:Q20605; CeAMT3, GB:Q21565; CeAMT4, GB:AAA83579), rice (OsAMT1. GB:AAB58937), Cornyebacterium glutamicum (CgAMT, GB:CAA63770), Lotus japonicus (LjAMT1.1, GB:AAG24944), tomato (LeAMT1.1, GB:X92854; LeAMT1.2, GB:CAA64475; LeAMT1.3, GB:AAG11397) and Brassica napus (BnAMT1.2, GB:AAG28780).

Schematic model for the membrane topology of AtAMT1.1. The model (above) is redrawn from (Thomas et al., 2000) and the predicted locations of the eleven transmembrane domains are indicated in red on the AtAMT1.1 amino acid sequence (below). The precise start and end points of these transmembrane domains in AtAMT1.1 were taken from the predictions in the Arabidopsis Membrane Protein Library (http://www.cbs.umn.edu/arabidopsis ). A conserved aspartate residue suggested as a possible NH4+ binding site (Thomas et al., 2000) is indicated on the topological model.

Model for the feedback regulation of the AtAMT1.1 gene by N metabolites. While glutamine may repress AtAMT1.1 expression at the transcriptional level, NH4+ may act post-transcriptionally (e.g. on mRNA translation or targeting of the protein) or may have direct effects on the activity or kinetic properties of the AtAMT1.1 transporter. Model based on that proposed by (Rawat et al., 1999).

Segmented agar plate (SAP) method for applying localised nutrient treatment to Arabidopsis roots. Figure adapted from (Zhang and Forde, 1998). To prevent diffusion of nutrients between different treatment zones, agar plates are divided into three segments using a sterile scalpel. For localised NO3− treatments, the agar contains a basal supply of N (10 µM NH4NO3) and the middle segment is supplemented with either 1 mM KNO3 or (as control) 1 mM KCl. At the start of the experiment (1), seedlings with roots ca 2 cm long are placed on the top segment, with just a few mm of the primary root apex resting on the middle segment. The plates are incubated vertically while the primary roots grow over the surface of the middle (treated) segment and onto the bottom segment (2). Around 10–12 d after seedling transfer (3), lateral root lengths in each segment are measured.

Localised stimulation of lateral root growth by NO3−. Seedling 1 (control): wild-type seedling grown on segmented agar plate containing low NO3− (10 µM NH4NO3) in all three segments; Seedling 2: wild-type seedling exposed to a localised supply of 1 mM KNO3; Seedling 3: transgenic line S10 (in which expression of the ANR1 MADS-box gene has been down-regulated by co-suppression) exposed to a localised supply of 1 mM KNO3 (Zhang and Forde, 1998).

Model for NO3− signalling pathway leading to localised stimulation of lateral root growth. The external NO3− supply is monitored by individual lateral root tips and the signal is transduced via the NO3—inducible ANR1 gene and the auxin-sensitivity gene AXR4 to produce increased meristematic activity. The identity and sub-cellular location of the NO3− receptor/sensor are unknown, as is the mechanism for induction of ANR1. ANR1 has tentatively been placed upstream of ANR1 in the signal transduction pathway. The model is based on that proposed by (Zhang et al., 1999). See text for further details.

‘Dual pathway’ model for NO3− regulation of root branching by nitrate. (1). Localised stimulatory pathway responding to changes in the external NO3− supply (see Figure 10). (2) Systemic inhibitory pathway, requiring the uptake and transport of NO3− to the shoot. (3) Maturation of the lateral root primordium is under the control of shoot-derived inhibitory signal that becomes prevalent at high shoot NO3− concentrations. (4) An increased supply of sucrose is able to alleviate the inhibitory effect of high NO3− supplies. The model is based on that proposed by (Zhang et al., 1999). See text for further details.
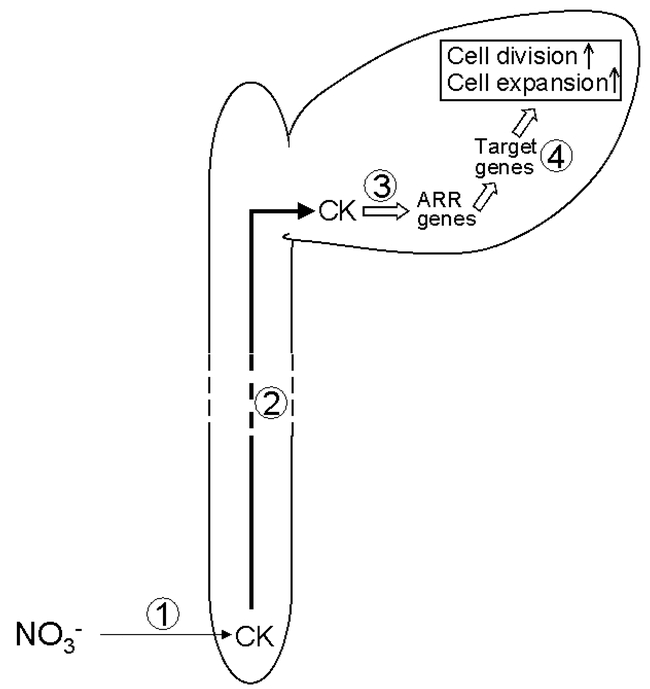
Model for the control of leaf expansion by the NO3− supply to the root. (1) The external supply of NO3− stimulates cytokinin (CK) production in the root. (2) CKs are transported to the shoot via the xylem. (3) CKs stimulate expression of members of the ARR (Arabidopsis response regulator) family of transcription factors. (4) The ARR transcription factor(s) activate a set of target genes to stimulate cell division and cell expansion in the leaf. See text for further details.
References
-
- Alvarez-Buylla E. R., Liljegren S. J., Pelaz S., Gold S. E., Burgeff C., Ditta G. S., Vergara-Silva F., Yanofsky M. F. MADS-box gene evolution beyond flowers: expression in pollen, endosperm, guard cells, roots and trichomes. Plant J. 2000;241(1):457–466. - PubMed
-
- Amtmann A., Sanders D. Mechanisms of Na+ uptake by plant cells. Adv. Botan. Res. 1999;291(1):75–112.
LinkOut - more resources
Full Text Sources