. 2009:7:e0126.
doi: 10.1199/tab.0126. Epub 2009 Nov 12.

Embryogenesis: pattern formation from a single cell

Affiliations

Embryogenesis: pattern formation from a single cell

Arnaud Capron et al. Arabidopsis Book. 2009.

Abstract

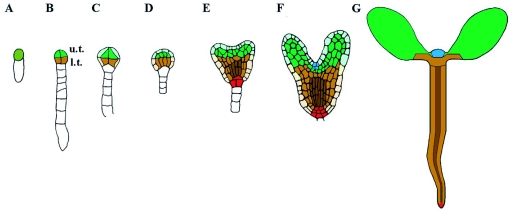
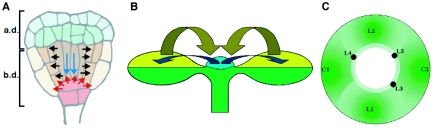
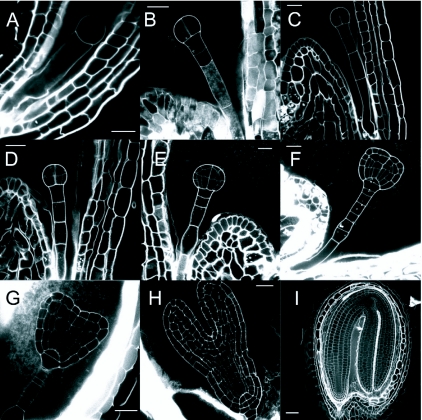
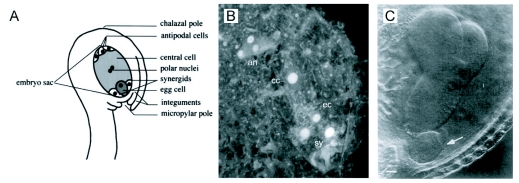
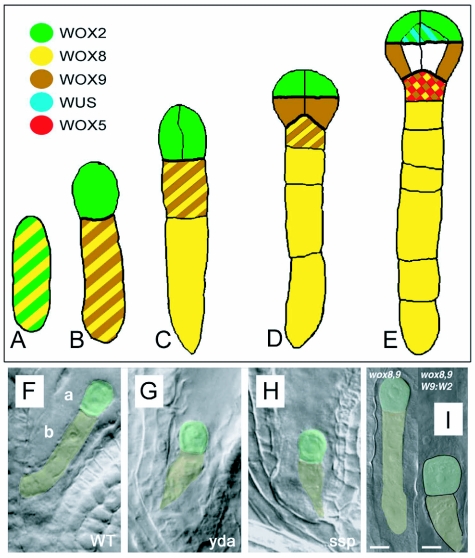
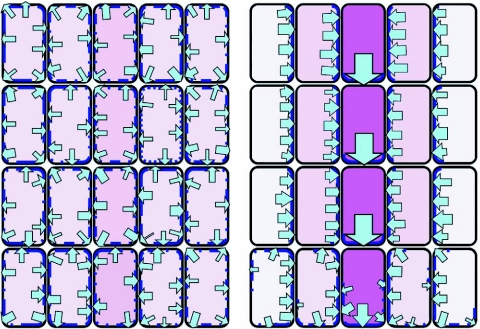
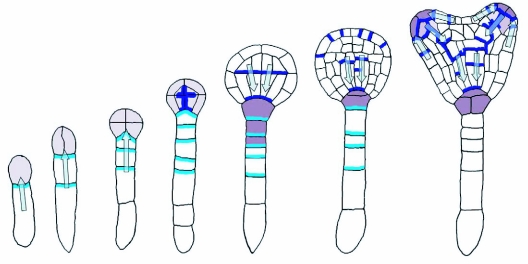
During embryogenesis a single cell gives rise to a functional multicellular organism. In higher plants, as in many other multicellular systems, essential architectural features, such as body axes and major tissue layers are established early in embryogenesis and serve as a positional framework for subsequent pattern elaboration. In Arabidopsis, the apicalbasal axis and the radial pattern of tissues wrapped around it are already recognizable in young embryos of only about a hundred cells in size. This early axial pattern seems to provide a coordinate system for the embryonic initiation of shoot and root. Findings from genetic studies in Arabidopsis are revealing molecular mechanisms underlying the initial establishment of the axial core pattern and its subsequent elaboration into functional shoots and roots. The genetic programs operating in the early embryo organize functional cell patterns rapidly and reproducibly from minimal cell numbers. Understanding their molecular details could therefore greatly expand our ability to generate plant body patterns de novo, with important implications for plant breeding and biotechnology.


Figures

Figure 1.
Figure 1.
Embryonic origin of seedling structures. The reproducibility of Arabidopsis embryo development enables tracing the origin of seedling organs and tissues to progenitor cells in the early embryo. Colors identify corresponding regions in embryo and seedling. A detailed description of embryonic stages is given in Figure 3. Radial subdivision; grayscale: vascular tissues, dark; ground tissue, plain color; epidermis, lightly shaded (missing in G). Apical-basal subdivision; upper and lower tier descendants are colored in green and brown, respectively. The most distal part of the root meristem (red) originates from the uppermost suspensor cell (hypophyseal cell. Section 4.2).
Figure 2.
Figure 2.
Positional references provided by the early embryo pattern. Arrows indicate presumed pattern transmission mechanisms, which are discussed in sections 4 and 5. (A) Triangular-stage embryo with central vascular cylinder (narrow cells in the center). Black arrows indicate signaling from the vascular cylinder to induce radial patterning in the overlying ground tissue (Section 5.3.); blue arrows indicate the likely dependence of hypophyseal cell fate acquisition on apical signals (Section 4.2.2.). Signals from hypophyseal derivatives (red arrows) confer stem cell identity in the root meristem (a.d. and b.d. = the apical and basal domains respectively. Section 4). (B) Signals from the shoot meristem promote adaxial-abaxial polarity in leaves, while conversely, adaxial cell fate in leaf primordia promotes shoot meristem development, yellow arrows (Section 4.3.1). (C) Positioning of lateral shoot organs. Primordia are restricted to the peripheral zone of the meristem. Initiated with an arbitrarily positioned cotyledon primordium (C1), graded lateral inhibition (indicated by green gradients) could restrict C2 to a position opposite C1 (Section 4.3.2). As subsequent leaf primordia (L1–L5) are produced, less synchronous differential inhibition would lead to a gradual transition of phyllotactic angles from 180° to 137°.
None
Figure 3. Stages of Arabidopsis embryogenesis. (A) Early embryo, with a single cell in the embryo proper. (B) Early embryo with 2 cells in the embryo proper. (C) Octant stage; four of eight cells in two tiers are visible. Cells of the upper and lower tier (u.t. and l.t.) of the octant will give rise to specific parts of the seedling (see Figure 1). Together with descendants of the uppermost suspensor cell (hypophyseal cell) the eight ‘octant’ cells will form all the structures of the seedling. (D) Dermatogen stage. A tangential division of each of the eight ‘octant’ cells produces inner cells and epidermis (protoderm) cells. (E) Early globular stage; divisions of the inner cells immediately after the dermatogen stage are oriented in the apical-basal dimension, endowing the embryo with a morphologically recognizable axis. (F) Triangular stage; now a polarized pattern of major elements is recognizable (see text): u.t. cells have generated two symmetrically positioned cotyledon primordia and l.t. cells a radially patterned cylinder (comprising epidermis, ground tissue and vascular tissue). Additional divisions distinguish the ‘hypophyseal cell’ from other suspensor cells. Its descendants will ultimately form the quiescent center of the primary root meristem and the columella initials. (G) Heart stage; cotyleldon outgrowth. Subsequently, cells between the outgrowing cotyledons initiate the primary shoot meristem. (H) Mid-torpedo stage; enlargement of cotyledons and hypocotyl and further elaboration of the radial pattern. (I) Bent cotyledon stage embryo with elaborated radial pattern in different organs. In the cotyledons a single adaxial subepidermal layer of elongated cells (palisade mesophyll) can be distinguished from underlying mesophyll cells. The radial pattern of the hypocotyl is comprised of a single cell layer of epidermal cells, two cortex layers, one endodermis and one pericycle layer enclosing the vascular cylinder. Bar is 5 µm in A, 10 µm in B, G and H, 15 µm in C and E, 20 µm in D and F, 50 µm in I. Images kindly provided by J. Runions, are also available at: https://www.brookes.ac.uk/lifesci/runions/HTMLpages/Embryo%20development.html!
Figure 4.
Figure 4.
Maternal polarity and embryo development. (A) The egg cell develops at the micropylar end of the embryo sac and its basal pole points towards the outside. From Mordhorst et al. (1997) (B) Confocal image of an Arabidopsis thaliana mature embryo sac, showing the central cell nucleus (cc) after fusion of the polar nuclei, the location of the antipodal cells (an) at the chalazial pole, the egg cell nucleus (ec), and the synergids (sy) at the mycropylar pole. From Capron et al. (2003) (C) The twin mutants develop two embryos of opposite polarity. Arrow points at the basal end of a second embryo developing from a suspensor cell. From Vernon and Meinke (1994).
Figure 5.
Figure 5.
Apical-basal WOX expression domains. (A-E) Expression domains of WUSCHEL-RELATED HOMEOBOX (WOX) genes during the early stages of embryogenesis and development from the single-celled zygote. Images A–E are redrawn after Haecker et al. (2004) and Nawy et al. (2008). (A) The zygote expressing WOX2 (green) and WOX8 (yellow), which subsequently mark the apical and basal daughter cells of the first division (B). (B) WOX9 is upregulated in the basal cell at this time. (C) After division of the basal cell, WOX9 is expressed only in the more apical cell, while WOX8 is expressed in both daughter cells. (D) At the octant stage, the upper and lower tiers of embryo proper are marked by WOX2 and WOX9 expression, respectively. Both WOX8 and 9 are expressed in the hypophysis. (E) At the dermatogen stage WOX9 expression is downregulated in the embryo proper, except for the outer cells of the lower tier. Simultaneously, WUSCHEL is turned on in the inner cells of the upper tier and WOX5 within the hypophysis. (F–I) The fundamental fate decision that leads to the separation of apical and basal cells with differing characteristics is dependent on the YODA/MPK (YDA/MPK) pathway and may also be regulated by WOX gene expression. (F) Apical (a) and basal (b) cell proportions in wildtype. (G, H) Loss of YDA or SHORT SUSPENSOR (SSP) function appears to allow apical cell fate to be expressed in the basal cell and its descendants. In these mutants elongation of the zygote is suppressed and subsequent division and development of the suspensor from the basal cell is affected. Images F–H reproduced from Bayer et al. (2009) with permission from the American Association for the Advancement of Science. (I) In wox8 wox9 double mutants, WOX2 and other apical cell lineage features are not expressed. Expression of WOX2 seems to be instrumental in apicalfate acquisition, because targeted mis-expression of WOX2 confers apical-cell features. Scale bars in I=10µm. Image reproduced from Breuninger et al. (2008) with permission from Elsevier Limited.
Figure 6.
Figure 6.
Integration of cell polarity through auxin transport. A highly schematic view. Rectangles represent cells and arrows of different strength represent the Intensity of auxin flow. For simplicity it is assumed that Intensity and direction of auxin flow is solely controlled through the quantity and distribution of auxin efflux carriers (dark blue) in the plasma membrane. Routes of preferred auxin transport have been associated with sites of vascular differentiation (dark purple). The central proposition is that auxin flow and cell polarization are connected in a positive feedback loop, Illustrated here by restricting auxin efflux to the basal side of each cell as an expression of cell polarization. Thereby, cells in a given region, Including cells newly formed by division, would Integrate polarity. The feedback system could further Include the stabilization of auxin sources or sinks. Note that the same cellular feed-back mechanism would progressively enhance Initial differences in auxin conductivity leading to the specification of different cell types in the radial dimension. Drawn after Sachs (1991).
Figure 7.
Figure 7.
Auxin flux and auxin perception maxima during embryogenesis. In the early stages of embryogenesis, localization of the PIN7 auxin efflux facilitator (cyan) to the apical membranes of basal cell and subsequently suspensor cells appears to drive auxin flux (arrows) upwards. A weak DR-5 marked auxin perception maximum (light purple) suggestive of auxin accumulation is seen in the apical parts of the developing embryo up to and including the dermatogen stage. During the globular stage PIN1 (dark blue) localization in the basal membranes of the inner cells of the embryo is associated with a switch in the apparent direction of auxin flux to apical — basal. At this time PIN7 is now seen concentrated in the basal membranes of the hypophysis and suspensor cells. A stronger auxin perception maximum (purple) also appears in the hypophysis and apical cells of the suspensor, which becomes restricted to the daughter cells of the hypophysis. PIN1 distribution in the cells of the L1 layer is associated with the generation of auxin perception maxima at the positions of incipient cotyledon initiation. Figure redrawn from Jenik et al. (2007) with permission from Annual Reviews.
Figure 8.
Figure 8.
Auxin Signaling and GNOM-dependent PIN1 localization. (A) Auxin accumulates in certain cells through coordinated transport mediated by the PIN proteins and this accumulation leads to the activation of the ARFs. At low auxin concentration, ARFs are maintained in a complex with the Aux/IAA proteins that act as transcriptional repressors. At high auxin concentrations, auxin bound to a TIR1 related F-Box protein within a SCF complex stabilizes the interaction between the complex and its target, the Aux/IAA protein. The SCF complex catalyzes the ubiquitination (U) of the Aux/IAA target and marks it for degradation by the proteasome, releasing ARF activity. This, in turn, may affect PIN genes expression and auxin transport properties of the respective cells, leading to potentially complex mutual influences between auxin distribution and transport patterns. (B) Polar targeting of PIN1: The original transport of PIN1 from the ER/Golgi (on the right side of the figure) is non-polar. However, an ARF GEF-dependent transcytosis mechanism then targets the PIN1 protein to the apical or basal side of the cell. The ARF GEF GNOM is involved in the basal targeting of PIN1. Image reproduced from Kleine-Vehn and Friml (2008) with permission from Annual Reviews. PIN1 is represented in blue, ARF in green and ARF GEF in yellow.
Figure 9.
Figure 9.
A mutation in TOPLESS (tpl-1) rescues aspects of the bodenlos/iaa12 (bdl) mutant phenotype. A, E, I: Wildtype (WT). B, F, J: The tpl-1 mutant. C, G, K: bdl. D, H, L: tpl1 bdl double mutant. (A) Wildtype seedling with normal root (pale blue) and vascular development in the cotyledons. (B) The temperature sensitive tpl-1 mutant, showing the weaker apical defects at permissive temperatures on the left. On the right, at non-permissive temperatures, a complete homeotic transformation of the shoot into a root takes place. (C) The bdl mutant showing the replacement of the primary root with an undifferentiated basal peg, and defects in cotyledon vasculature. (D) Introduction of tpl-1 into the bdl background permits improved development of the root. In the apical domain, it ameliorates some of the vascular defects present in the single bdl mutant. Heart stage embryos of WT (E, I), tpl-1 (F, J), bdl (G, K) and tpl-1 bdl (H, L). Images A–D drawn after Osmont and Hardtke (2008). (E–H) The lens-shaped cell and derivatives that normally gives rise to the quiescent center of the RAM are outlined. (I–L) Associated auxin perception maxima marked by DR5rev::GFP. Introducing tpl-1 to the bdl background restores the correct formation of the lensshaped cell (compare H with G) and reinstates DR5rev::GFP expression in this region (compare L with K). Images E–L reproduced from Szemenyei et al. (2008) with permission from the American Association for the Advancement of Science.
Figure 10.
Figure 10.
Cell fate specification in the root meristem. (A) Organization of cell types in the root meristem. Centrally located QC cells (grey) are flanked by initials of various tissues: initials extending tissue layers in the growing root and, laterally and basally, initials replenishing cells in the lateral (violet) and central root cap (orange). Blue arrows indicate that the acquisition of QC cell fate seems to be dependent on signals from the shoot (compare Figure 2A); red arrows the dependence of stem cell fate on signals from the QC. Black arrows represent endodermis inducing signals from the stele (Figure 18) and green arrows the stabilization of tissue identity within each layer. (B) An auxin-response reporter gene detects a maximum (blue) at the position of the columella initial cells. (C) When the auxin response maximum is displaced (e.g. because of auxin transport inhibition), the positions of all three cell types in relation to the stele and auxin response maximum are maintained, suggesting an important role for auxin distribution in root meristem patterning. From Scheres (2000).
Figure 11.
Figure 11.
Specification of the QC initial. In the globular embryo, the PLT genes are widely expressed in the l.t., while SHR mRNA is present in its the central cells. SCR is expressed in the hypophysis. In the heart embryo the PLT genes are expressed throughout the future vascular cylinder, as well as in the lens-shaped progenitor cell of the QC. SHR mRNA is expressed in the stele, but the SHR protein is found in ground tissue surrounding the stele and the lens shaped cell, where it promotes SCR expression. SCR and the PLT genes promote QC fate of the lens-shaped cell. Redrawn after Stahl and Simon (2005).
Figure 12.
Figure 12.
Embryonic expression of WUS. WUS transcripts are first detected in 16-cell dermatogen-stage embryos (red). Initially expressed in all subepidermal cells of the apical domain, WUS transcripts become gradually restricted to more central positions and deeper layers at the base of the shoot meristem. No functions have been assigned to WUS expression prior to the heart-stage and the molecular basis of WUS regulation is unclear. Precise regulation of WUS expression is critical to the formation of the apical pattern, since ectopic expression of WUS seems to confer stem cell identity at inappropriate sites (Gallois et al., 2004). Modified from Mayer and Jurgens (1998).
Figure 13.
Figure 13.
Regulatory interactions in SAM development. (A–F) In situ hybridizations of STM (A, B), CUC2 (C, D) and AS1 (E, F), in globular (A, C, E) and heart (B, D, F) stage embryos. Arrowheads in C and D point to the protoderm, where CUC2 is absent. The arrowhead in F indicates the SAM initials. Images A, B reproduced with permission from Macmillan Publishers Ltd: Nature, Long et al. (1996); C, D reproduced/adapted from Aida et al. (1999) with permission from The Company of Biologists; E, F reproduced with permission from Macmillan Publishers Ltd: Nature, Byrne et al. (2000). (G) Schematic representation of the expression domain shown in A–F. (H) Model of STM/CUC/AS interactions. The expression domains of STM and CUC2 (and the other CUC genes) are largely overlapping at the globular stage. Activity of CUCs promotes STM expression (A, C). Conversely, STM downregulates the CUCs. (B, D). STM activity promotes the establishment and maintenance of the SAM. This is in part accomplished by another function of STM: to inhibit expression of the genes AS1 and AS2 (here represented by AS1) in the SAM. The counter-acting activities of CUCs and STM lead to the formation of a torus of CUC expression around a STM domain centered on the SAM in the bent cotyledon stage, depicted in I. (I) Schematic transverse section through the apex of a bent cotyledon embryo showing the inner STM expression domain surrounded by the CUC2 domain.
Figure 14.
Figure 14.
Auxin and lateral organ initiation. (A–D) Model for lateral organ initiation by auxin. (A) Convergent auxin transport within the L1 layer predicts positions of lateral organ initiation. Basipetal auxin transport routes appear to develop within and beneath these new organs. As this removes auxin from the L1 areas near the emerging primordia, the process will most likely reiterated furthest away from the existing primordia. (B) The localization of PIN efflux proteins in the L1 layer concentrates auxin at sites of subsequent lateral organ initiation. PIN proteins also mediate basipetal transport from the site of initiation. (C) Auxin transport inhibitors (such as NPA) prevent organ initiation. This block can be overcome and lateral organ initiation can be achieved by localized application of auxin. (D) If excessive auxin is added to NPA treated meristems, threshold levels of the hormone are achieved over a wide area of the peripheral zone and enlarged organs are produced. A–D drawn from model by Reinhardt et al. (2003). (E) Localization of PIN auxin efflux facilitators (dark blue) in the L1 layer is consistent with the converging auxin transport and accumulation at sites of incipient lateral organ initiation. Auxin influx associated proteins (red) are thought to help scavenge intracellular auxin and retain it in the cells of the L1 layer. Drawn from Reinhardt et al. (2003) and Reinhardt (2005). (F) Model for positioning of cotyledons. In the late-globular stage embryo cotyledons appear to be initiated in rapid succession (Woodrick et al., 2000). Auxin accumulation at the first site of initiation ensures that only in the opposed position can sufficient auxin be accumulated to initiate the second cotyledon. Post-germination the first true leaf is initiated at one of two positions between the two cotyledon primordia, where sufficient auxin can accumulate to initiate a new lateral organ.
Figure 15.
Figure 15.
Establishment of central/peripheral and adaxial/abaxial polarity. (A–F) In situ hybridization of REV (A, B), FIL (C, D) and KAN1 (E, F), in globular (A, C, E) and heart (B, D, F) stage embryos. Images A, B reproduced from Emery et al. (2003) with permission from Elsevier Limited; C, D reproduced/adapted from Siegfried et al. (1999) with permission from The Company of Biologists; E, F reproduced with permission from Macmillan Publishers Ltd: Nature, Kerstetter et al. (2001). (G) Schematic representation of the expression domain shown in A–F. The class III HD-ZIP genes, here represented by REVOLUTA, are expressed in the central domain at the globular and heart stage, while the YABBY genes, represented by FILAMENTOUS FLOWER, and the KANADI genes, represented by KANANDI1, mark the peripheral domain. The activity of the class III HD-ZIPs promotes a central/adaxial fate in their domain of expression, which is also crucial for initiation of the SAM, while the KAN/YAB genes promote a peripheral/abaxial fate simultaneously limiting the expansion of the SAM. The balance of these antagonistic activities is critical for aspects of radial patterning in the embryo axis as well as for the appropriate adaxial/abaxial polarity in lateral organs, including cotyledons.
Figure 16.
Figure 16.
Hypothetical mechanisms to separate epidermis and inner cell fate. (A) A stable morphogen gradient (blue) could specify radial cell fates. This mechanism would allow for the concentration dependent specification of several cell identities, but only two fates, outer (epidermal) and inner cells, are specified at this stage. (B) Alternatively, epidermal cell fate (yellow) could depend on signals from outside. External signals could originate from the surrounding milieu (orange arrows) or could be stored in the outer cell wall (red crosses) inherited from the zygote. Cells excluded from the external signal would switch to an inner cell ground state (purple). (C) Subsequent radial patterning occurs along the axis of an elongating cylinder and may therefore be specified by a separate mechanism. This process is initiated with the formation of procambial tissue in the basal domain (brown, versus apical domain green).
Figure 17.
Figure 17.
Protodermal gene expression during embryogenesis. (A) At the octant stage AtML 1, PDF1 and PDF2 are expressed in all the apical cells of the embryo proper. (B) At the dermatogen stage, expression of these genes is restricted to the outer cells and the expression of other genes such as WUSCHEL and the class III HD-ZIP genes are specifically upregulated within the inner cells. (C–F) Images of fluorescent reporter constructs for the expression of AtML1. C: AtML1 reporter expression in both the apical and basal cell after division of the zygote. Images C–F reproduced/adapted from Takada and Jürgens (2007) with permission from The Company of Biologists. (D) At the dermatogen stage the reporter has been downregulated in the inner cells. (E, F) In the late globular and heart stages respectively, the AtML1 reporter marks the outer protodermal layer.
Figure 18.
Figure 18.
Radial patterning in the ground tissue. (A) The SHR gene is expressed in the vascular cylinder (brown), but its activity is required for radial patterning in the adjacent cortex-endodermal initials (orange) and in the endodermis (yellow). SHR protein moves (arrows) to cells surrounding the vascular cylinder, where it induces the expression of SCR and, with the exception of the QC (red), other endodermis specific genes. SCR acts downstream of SHR and is required for the periclinal divisions of ground tissue initials which yield the two layers of ground tissue and possibly, for maintaining endodermis identity in the inner layer. Modified after Helariutta et al. (2000). (B) SHR expression in the embryo. A green fluorescent protein reporter gene under control of the SHR promoter is expressed exclusively in the central procambium of a triangular stage embryo. Expression remains associated with vascular tissues throughout development. From Helariutta et al. (2000). Abbreviations: g, ground tissue; hyp, hypophysis; pc, procambium; pd, protoderm; su, suspensor. Bar = 25 µm. (C) SHR::GFP translational fusion protein is present in the stele, but selectively accumulates in the nuclei of endodermal cells (compare transcriptional fusion in insert). From Nakajima et al. (2001). Abbreviations: Cei, cortex/endodermis initial. Cor, cortex. End, endodermis. Epi, epidermis. Ste, stele. Qc, quiescent center. Bar = 50 µm. (D) Ectopic expression of SHR driven by the SCR promoter results extra layers expressing endodermal markers. SHR protein (red) can move one layer beyond its site of production. In normal development (upper panel), it is produced in the vascular tissues (brown) and triggers SCR expression (green) and differentiation events in the overlying ground tissue. SCR is required for periclinal cell divisions subdividing the ground tissue and for proper differentiation of the endodermis (yellow). Expression of SHR in the in the SCR domain leads to a reiteration of the layer-amplification process and eventually to supernumerary endodermal layers.

References

    1. Abe M., Takahashi T., Komeda Y. Cloning and characterization of an L1 layer-specific gene in Arabidopsis thaliana. Plant and Cell Physiology. 1999;407(1):571–580. - PubMed
    1. Abe M., Takahashi T., Komeda Y. Identification of a cis-regulatory element for L1 layer-specific gene expression, which is targeted by an L1-specific homeodomain protein. Plant J. 2001;267(1):487–494. - PubMed
    1. Abe M., Katsumata H., Komeda Y., T. Takahashi. Regulation of shoot epidermal cell differentiation by a pair of homeodomain proteins in Arabidopsis. Development. 2003;1307(1):635–643. - PubMed
    1. ]Aida M., Ishida T., Tasaka M. Shoot apical meristem and cotyledon formation during Arabidopsis embryogenesis: interaction among the CUP-SHAPED COTYLEDON and SHOOT MERISTEMLESS genes. Development. 1999;1267(1):1563–1570. - PubMed
    1. Aida M., Ishida T., Fukaki H., Fujisawa H., Tasaka M. Genes involved in organ separation in Arabidopsis: An analysis of the cup-shaped cotyledon mutant. Plant Cell. 1997;97(1):841–857. - PMC - PubMed

LinkOut - more resources