
Flower development

Elena R Alvarez-Buylla et al. Arabidopsis Book. 2010.

Abstract

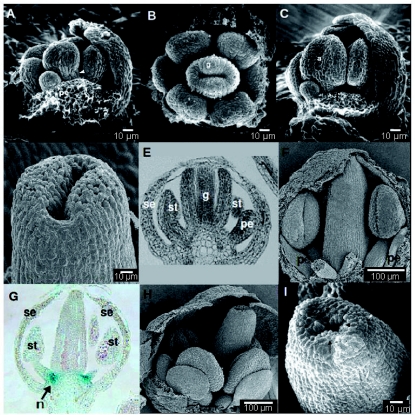
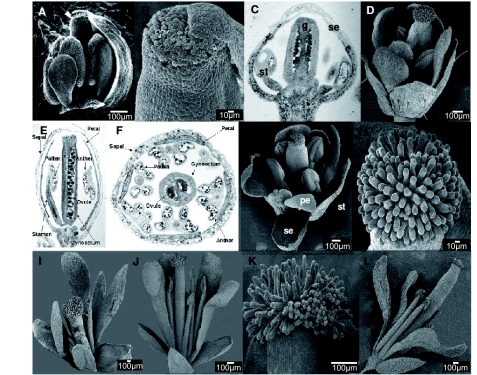
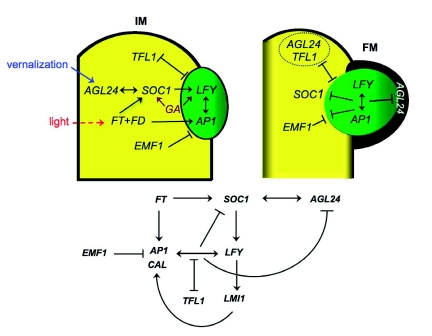
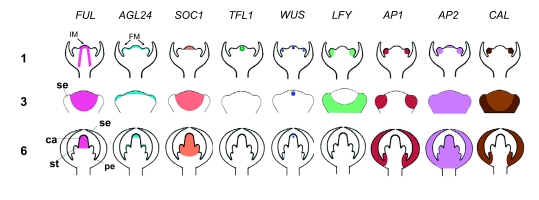
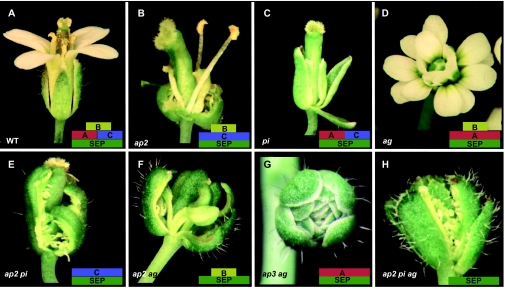
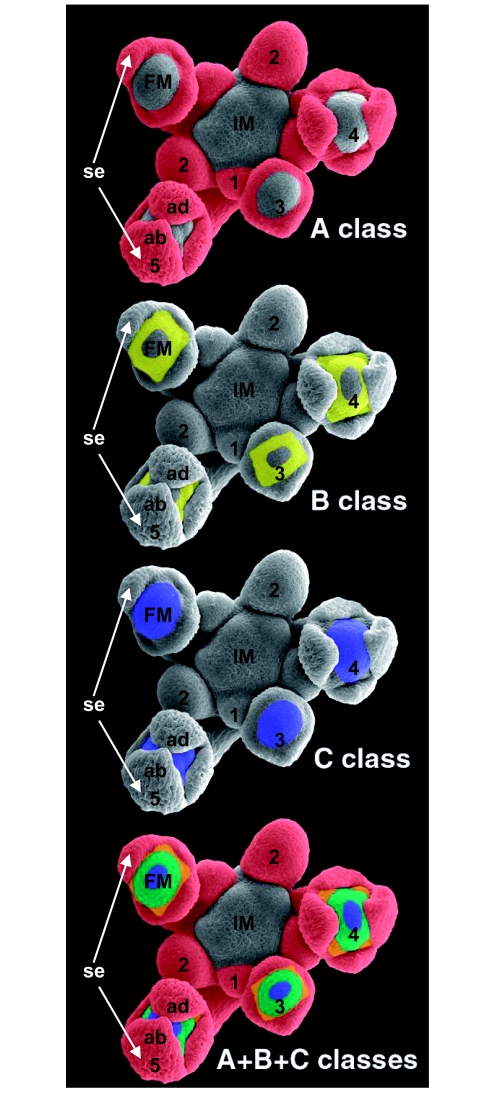
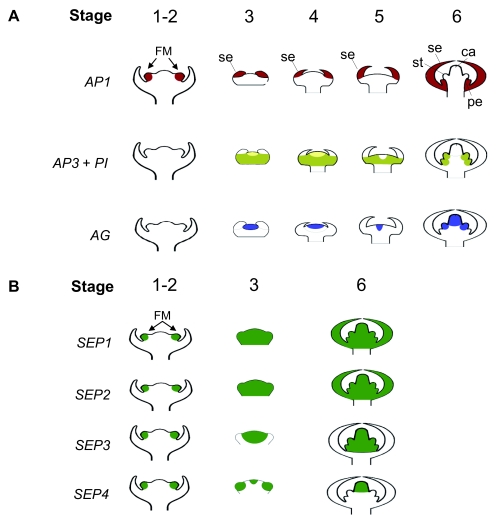
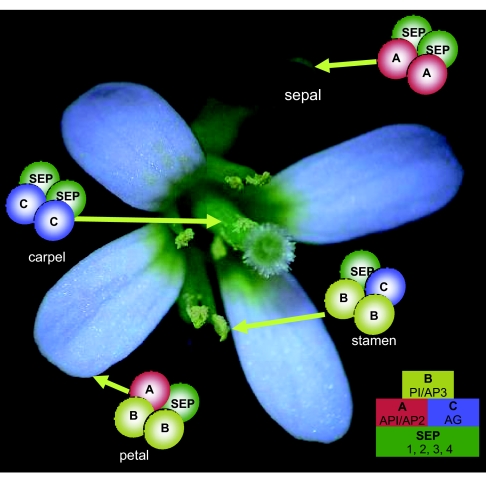
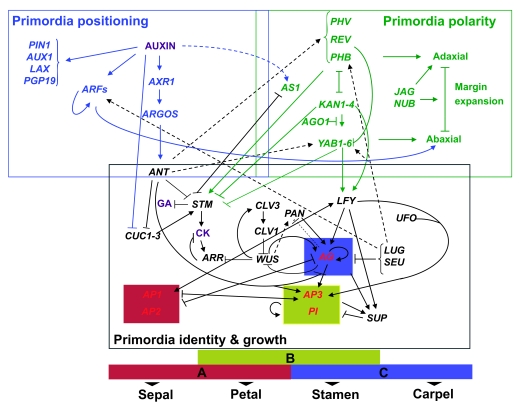
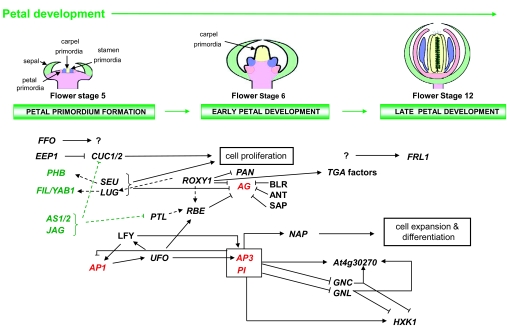
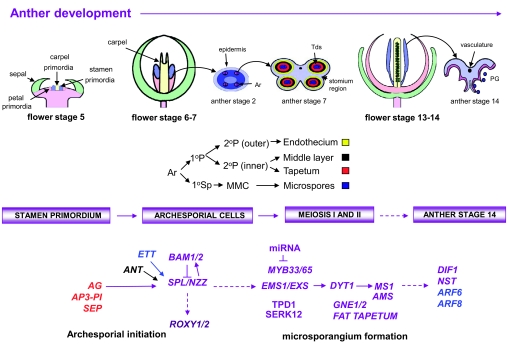
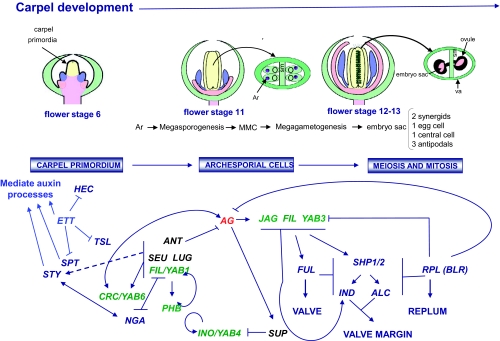
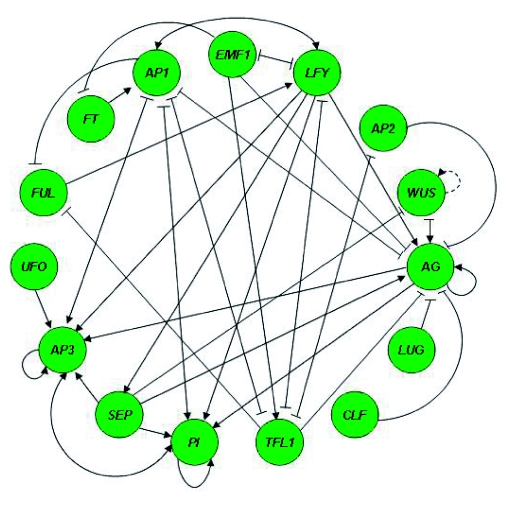
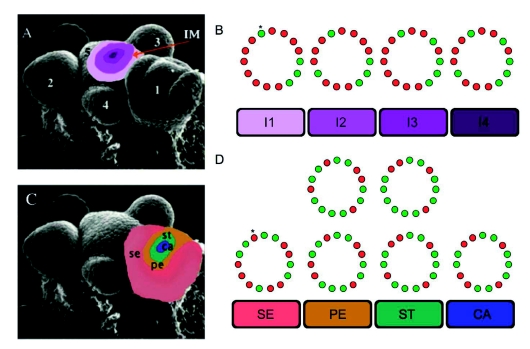
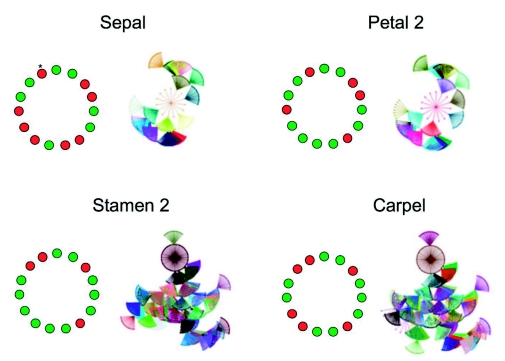
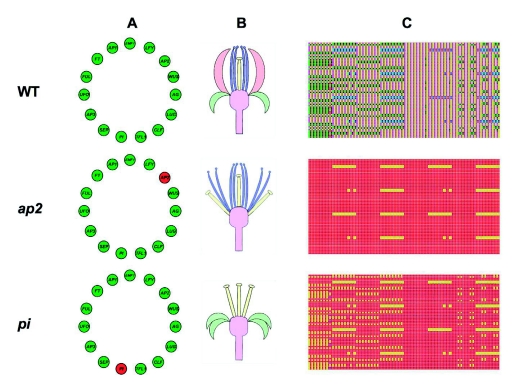
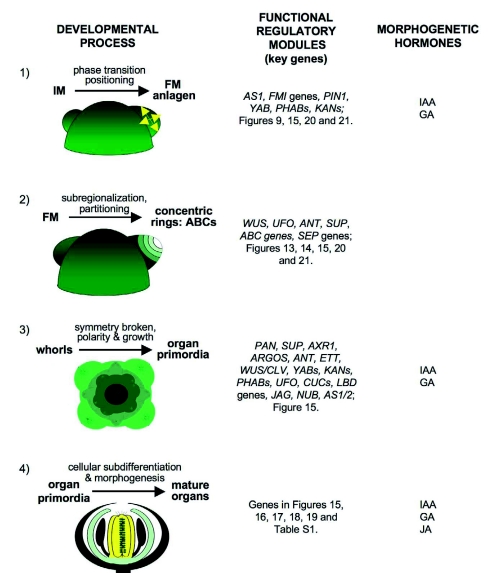
Flowers are the most complex structures of plants. Studies of Arabidopsis thaliana, which has typical eudicot flowers, have been fundamental in advancing the structural and molecular understanding of flower development. The main processes and stages of Arabidopsis flower development are summarized to provide a framework in which to interpret the detailed molecular genetic studies of genes assigned functions during flower development and is extended to recent genomics studies uncovering the key regulatory modules involved. Computational models have been used to study the concerted action and dynamics of the gene regulatory module that underlies patterning of the Arabidopsis inflorescence meristem and specification of the primordial cell types during early stages of flower development. This includes the gene combinations that specify sepal, petal, stamen and carpel identity, and genes that interact with them. As a dynamic gene regulatory network this module has been shown to converge to stable multigenic profiles that depend upon the overall network topology and are thus robust, which can explain the canalization of flower organ determination and the overall conservation of the basic flower plan among eudicots. Comparative and evolutionary approaches derived from Arabidopsis studies pave the way to studying the molecular basis of diverse floral morphologies.


Figures

Figure 1.
Figure 1.
Phylogenetic context of Arabidopsis thaliana: Evolutionary history of land plants. Phylogenetic tree of land plant evolution with some speciation events shown as colored nodes. White node, origin of land plants; light blue node, origin of vascular plants; blue node, origin of seed plants; dark blue node, origin of flowering plants. Here, Chara spp. from the green algae order Charales is the outgroup, since it has been used to root several recent molecular land plant phylogenies. The topology of this tree is based on studies by Soltis et al. (1999) and Nickrent et al. (2000). Time references in million years before present (MYBP) were taken from Judd et al. (2002).
Figure 2.
Figure 2.
Schematic representation of the shoot apical meristem (SAM): the inflorescence shoot apical meristem and floral meristem. (A) Diagram outlining the geometry of the inflorescence shoot apical meristem (IM) and flower meristem (FM) during the first stages of development of the latter. On the flank of the IM a first bulge that corresponds to the rudimentary bract (Br) appears. In its axil, a second bulge forms and this continues to grow engulfing the first one and forming the FM proper. Theses stages of FM development correspond to P2 and P3 according to Reddy et al. (2004). The arrow and arrowhead indicate the first and second visible grooves respectively (see section 2.3 for further detail). (B) Three distinctive zones make up the IM: the central zone (CZ) which contains the stem cells; the peripheral zone (PZ) on the flanks of the CZ that gives rise to the bract and floral primordia; and the rib zone (RZ) underneath the CZ that yields stem tissue. Three cell layers are distinguished: L1 and L2 layers constitute the tunica and include portions of both the CZ and the PZ. The rest of the cells form the L3 layer or corpus. In L1 and L2, cell divisions are anticlinal, while in L3 they occur in all directions (arrows, direction of cell division). The structure is maintained in the FM. (C) Schematic representation of the boundary zones (blue lines) and axes of polarity during floral development with the differentiation of sepals (se) from the floral primordium illustrated.
Figure 3.
Figure 3.
Summary of the 20 stages of flower development. Schematic representation of developmental stages of Arabidopsis flowers. Briefly, the flower primordium is formed at stages 1 and 2. At stage 3, sepal primordia are already visible and continue growing until they enclose the flower meristem (from stage 4 to 6). Meanwhile, at stage 5, petal and stamen primordia are beginning to be visible, and the gynoecium starts to form (stage 6). Organ development continues and by stage 9, stigmatic papillae arise at the top of the gynoecium. At stage 12, petals are similar in length to stamens. Anthesis occurs at stage 13, fertilization occurs, and the flower opens at stage 14. Siliques reach their maximum size and are green by stage 17, then they loose water and turn yellow (stage 18) until valves separate from dry siliques (stage 19) and seeds fall (stage 20). Floral meristems (FM), pink; sepals, green; petals, bright pink; stamens, blue; gynoecia, yellow; ovules, dark green; seeds orange and brown. Duration of each stage in hours (h) is given under the figures (from Smyth et al., 1990).
Figure 4.
Figure 4.
Stages 1 to 6 of Arabidopsis flower development. (A) and (B) Inflorescence shoot apical meristem (IM) and floral meristem (FM) at stage 1 and 2 as indicated. (C) and (D) Stage 3 FM showing abaxial (ab) and adaxial (ad) sepals (se). (E) At stage 4, lateral sepals (I) shown growing perpendicularly to the abaxial and adaxial ones. (F) and (Q) At stage 5, stamen primordia are visible (arrows) and sepals almost cover the rest of the meristem. (H) Flower bud where sepals are covering the stamens and the gynoecium primordium. (I) Section through a stage-6 flower primordium where the gynoecium (g), stamens (st), and sepals (se) are apparent. Pictures are scanning electron micrographs (SEM), except (D), (Q) and (I) which are optical images of histological sections. All pictures are of Columbia-0wild-type plants.
Figure 5.
Figure 5.
Stages 7 to 10 of Arabidopsis flower development. (A) Stage 7 in which petal (pe) and stamen (arrowhead) primordia are indicated. (B) Vertical view of the gynoecium (g) in a stage 7 floral primordium. (C) to (E) Carpels and stamens at stage 8 of floral development are shown. Filament (f) and anther (a) regions of the stamen are differentiated (C) and a slot is formed at the tip of the style in the gynoecium (D). Section through the floral bud with sepals (se), petals (pe), stamens (st) and gynoecium (g) indicated (E). (F) and (G) Floral bud at stage 9 in which petal primordia (pe) are indicated (F). Section through flower primordium (Q) in which XALV.GUS is shown staining nectaries (n). (H) and (I) Stage 10 flowers. Flower bud showing the enlarged sepals which cover other floral organs, stalked petals and stamens, and developing carpels in the center (H). Stigma starts to be formed at the top of the gynoecium (I, arrows) Bars = 10 µm except in (F) and (H). Images (A), (B), (C), (G) and (I) are of Lansberg erecta ecotype, from Smyth et al. (1990) provided by Dr J. Bowman. Some sepals were removed from flower buds shown in (A), (B), (C), (D), (F), (H) and (I). All images except (E) and (Q) are SEM. (D), (E), (F), (H) are of Columbia-0 ecotype.
Figure 6.
Figure 6.
Stages 11 to 16 of Arabidopsis flower development. (A) to (C) Stage 11 of flower development where the gynoecium develops stigmatic papillae (arrows) (A) and (B). Longitudinal section where sepals (se), stamen (st), and gynoecium (g) are indicated (C). (D) to (F) Flower primordium at stage 12. Longitudinal (E) and transverse (F) sections showing all the organs as well as ovules and pollen grains. (G) and (H) Flower anthesis at early stage 13 when the stigma (arrowhead) is already receptive (Q); a close-up view of the stigma (H). (I) to (L) Flower primordium at stages 14 (I) and 15 where the gynoecium has begun to enlarge to form the silique (J). Close-up of a stage-15 stigma (K) and stage-16 flowers where sepals and petals are beginning to wither (L). Bars = 100 µm. All images except (C), (E) and (F) are SEM. Images are of Columbia-0 ecotype, except (A) that is of Landsberg erecta (from Smyth et al.,1990, provided by Dr. J. Bowman).
Figure 7.
Figure 7.
Stages 17 to 20 of Arabidopsis flower development. (A) to (D) Photographs of developing and mature siliques at stages 17 (A), 18 (B), 19 (C), and 20 (D) of flower development. (E) SEM of seeds from a silique at stage 17. (F) Close-up view of a seed from a stage-20 dehiscent silique. All photographs are of Columbia-0 ecotype.
Figure 8.
Figure 8.
Sepal and petal cell types. Scanning electron micrographs (SEM) of wild-type flowers and flower organs. (A) A mature flower with sepals (se) and petals (pe) fully expanded and the stigma extending above the long stamens. (B) Sepal blade showing simple unbranched trichomes (arrowheads) characteristic of the abaxial surface. (C) Mature petal blade consisting of a basal claw and a distal blade. (D) Adaxial sepal surface with irregular sizes and shapes of cells, some elongated (800x). (E) Abaxial sepal surface bearing stomata (arrows) and characteristic elongated cells (500x). (F) Adaxial surface of a mature petal blade showing conical cells with epicuticular thickenings running from the base to the apex (800x). (G) Abaxial petal surface showing flatter, cobblestone-shaped cells with cuticular thickenings. Both petal surfaces lack stomata.
Figure 9.
Figure 9.
Inflorescence shoot apical meristem (IM) versus flower meristem (FM). Simplified model of a gene regulatory network (GRN) that induces and maintains the FM. Flowering induction genes like FT, SOC1 and AGL24 are highly expressed in the IM in response to external (vernalization and light) and internal (gibberellins; GA) signals. These proteins in turn promote the expression of flower meristem identity (FMI) genes, LFY and AP1. Paradoxically, during the establishment of the FM, genes like TFL1 and EMF1 that help to maintain the IM identity are also expressed, keeping the expression of the FMI genes out of the IM. Later in development, LFY and AP1 repress the expression of TFL1 and flowering genes SOC1 and AGL24, among others, thus maintaining the FMI. Arrows and bars indicate positive and negative regulatory interactions respectively. (See references in main text).
Figure 10.
Figure 10.
Schematic representation of some inflorescence shoot apical (IM) and flower (FM) meristem gene expression patterns at stages 1, 3 and 6. Flowering (FUL, AGL24 and SOC), indeterminate (WUS and TFL1), and FMI (LFY, AP1, AP2 and CAL) gene expression patterns based on in situ hybridization data during floral primordium developmental stages 1, 3 and 6. At stage 1, expression patterns correspond to their functions in IM and FM identities. Sepal (se), petal (pe), stamen (st) and carpel (ca) primordia are indicated. At stages 3 to 6, all with the exception of TFL1 are expressed in the FM, probably because their respective proteins also affect organ development. FUL will participate in fruit development, LFY will induce all the ABC genes and AP1 and AP2 are fundamental in sepal and petal formation (see references in main text).
Figure 11.
Figure 11.
Arabidopsis ABC homeotic floral mutants. Photos of single, double and triple ABC gene mutant flowers. Each photo is accompanied by a small diagram where rectangles represent the A (AP1 and AP2), B (AP3 and Pl), and C (AG) combinatorial transcriptional regulatory functions and the SEP (1, 2, 3, 4) genes active in these mutants. Organs are listed below from the outer to the inner whorl unless stated otherwise. (A) Wild-type (WT) flower. (B) Single ap2 mutant flower composed of carpelloid sepals, stamens, stamens and carpels. (C) The pi mutant has flowers composed of sepals, sepals, carpels and carpels. (D) The ag flower has the stamens transformed into petals and the carpels are replaced by another flower repeating the same pattern. (E) The ap2 pi double mutant displays flowers composed only of sepalloid carpels. (F) The ap2 ag flowers have leaf-like organs in the first and fourth whorls and mosaic petal/stamen organs in the second and third whorls. (G) ap3 ag double mutants produce flowers composed of repeated whorls of sepals. (H) The ap2 pi ag mutant has leaf-like organs with some residual carpel properties. (Photographs provided by Dr. J. Bowman).
Figure 12.
Figure 12.
Expression patterns of the ABC genes during early stages of Arabidopsis flower development. SEM of meristems have been colored to show expression patterns of A class (red, outer whorls), B class (yellow, petal and stamen primordia) and C class (blue, inner whorls) genes. Five flowers at early stages of development are marked 1 to 5 (5 being the oldest). Inflorescence shoot apical meristem (IM), floral meristem (FM) and sepals (se): adaxial (ad) and abaxial (ab) are indicated. (Photographs provided by Dr. J. Bowman).
Figure 13.
Figure 13.
Diagram illustrating mRNA expression patterns of Arabidopsis ABC and SEP genes during different stages of flower development. (A) ABC gene expression patterns illustrated from stage 1 to 6. The A function gene AP1 is expressed (red) in the two outer floral primordia whorls that will later develop into sepals (se) and petals (pe) (Mandel et al., 1992; Gustafson-Brown et al, 1994; Parcy et al., 1998).The A function gene AP2 is expressed in all four whorls of the flower (see figure 10; Jofuku et al., 1994). The B function genes (dark yellow) AP3 and PI are expressed from stage 3 in the next two inner whorls of the flower (Weigel and Meyerowitz, 1993; Parcy et al., 1998). Interestingly Pl is also expressed at stages 3 and 4 in cells that will generate the fourth whorl (light yellow). After stage 5, the pattern of PI expression largely coincides with that of AP3, only in petal and stamen (st) primordia (Goto and Meyerowitz, 1994). The C function gene AG is expressed (blue) in the two inner whorls that will become the stamens and carpels (ca) (Yanofsky et al., 1990; Gustafson-Brown et al., 1994; Parcy et al., 1998; Ito et al., 2004). (B) SEP gene expression pattern during several stages (1 or 2, 3 and 6) of flower development. SEP1 and SEP2 are expressed in all whorls of the flower (Savidge et al., 1995). SEP3 is first detected in late stage 2 flower primordia and afterwards in petal (pe), stamen (st), and carpel (ca) primordia. The expression pattern at stage 6 was deduced that from at stage 7 (Mandel and Yanofsky, 1998). SEP4 is weakly expressed in sepal primordia at stage 3 and strongly expressed in carpel primordia from stage 3 to 6. (Ditta et al., 2004). Both figures have been modified and expanded from Krizek and Fletcher (2005).
Figure 14.
Figure 14.
Schematic representation of the interaction of ABC and SEP proteins in the quartet model for Arabidopsis floral organ specification. Possible MADS-domain protein complexes (circles) of the ABC model are sufficient for the specification of each of the four floral organs. In the ABC model, rectangles represent the A (AP1 and AP2), B (AP3 and Pl), and C (AG) combinatorial transcriptional regulatory functions necessary for sepal, petal, stamen and carpel primordia specification. The green rectangle below represents the SEP (1, 2, 3 and 4) proteins that interact with proteins encoded by the ABC genes (unknown for AP2 which has not been tested) to specify each floral organ (modified from Bowman et al., 1993; Robles and Pelaz, 2005).
Figure 15.
Figure 15.
Functional gene regulatory modules during early flower development. Common molecular modules act during early meristem morphogenesis from the SAM both before and after reproduction. During floral organogenesis, these modules interact among themselves and with the FOS-GRN that includes the floral homeotic genes. Anlagen positioning in the SAM flanks depends on auxin gradients. Transport and signal transduction proteins, as well as other factors regulated by auxins (letters in blue), participate in the establishment of such gradients and finally determining the position of primordia. The auxin pathway also downregulates some members of the NAC family (CUC1 to 3 are important for organ boundary establishment), which also participate in the positive regulation of STM and KNOX genes. Since WUS maintains the apical meristem stem cells in a proliferating state with CLV proteins that in turn regulate its expression in a non cell-autonomous negative-positive feedback loop, and STM prevents meristem cell differentiation by inducing the production of cytokinins (CK) and the ARR transduction pathway (see text), floral primordia may emerge if cells in the anlagen are able to downregulate STM. This can be achieved by the action of AS1 and ANT. Upregulation of LFY by the flowering genes (Section 3.2; Figure 9) in conjunction with some KAN and YAB proteins, activate the expression of ABC homeotic genes (in red) for the establishment of the floral organ primordia identity and growth (gene acronyms in black, see text and Table S1 for full names). Lateral organ primordia acquire apical/basal, lateral/medial and adaxial/abaxial polarities by the action of protein families that include PHABs (PHB, PHV and REV), KANs (KANADI1–3, ATS/KAN4), YABs (FIL/YAB1, YAB2, YAB3, INO/YAB4, YAB5 and CRC/YAB6), JAG and NUB (letters in green). Some of these are organ-specific while others are shared by different floral organ primordia (see section 3.4). Not all the genes involved in each module are depicted, just some of the most representative ones, which help us to understand how they are interconnected. Arrows and bars indicate positive and negative regulatory interactions, respectively, and dashed lines a postulated interaction not yet proven. The text color used for the gene names in each module is the same as in Figures 16, 17, and 19 where specific organ developmental processes are summarized and the ABC genes are shown in boxes on the organ specified as in the model shown below. Hormones are in purple. This figure was composed partially from information in Clark (2001b), Blazquez et al. (2006), Hord et al. (2006), Shani et al. (2006) and Feng and Dickinson (2007).
Figure 16.
Figure 16.
Main stages of petal development and some genes involved. Schemes at the top illustrate three different stages of petal development (for details see section 2). Briefly, GRN modules (genes) in petal development include those involved in the establishment of the second whorl domain, the specification of petal identity and cell differentiation. CUC genes under the regulation of miR164c are involved in establishing whorl boundaries. Genes involved in polarity determination like JAG, PHB and YAB1 are also necessary for petal development. A, B and SEP genes, and the absence of C genes, determine petal identity (AP2 and SEP genes are not shown here for clarity; see Figures 11 and 14). Petal blades are formed by active cell division at early developmental stages and by cell enlargement and differentiation at later stages. Some of the genes expressed early need to be continuously expressed throughout petal growth, including ROXY1, SEU, and LUG. Downregulation of the GNC, GNL, and HXK1 genes inhibits chlorophyll accumulation and expression of photosynthetic genes. At4g30270 might be necessary for correct cell wall dynamics during petal growth (see text section 3.4.5 and Table S1 for details; Franks et al., 2006; Irish, 2008;). Gene color code as in Figure 15; arrows and bars indicate positive and negative regulatory interactions, respectively.
Figure 17.
Figure 17.
Stages of stamen development with emphasis on the genes implicated in anther formation. Schemes of some stages of flower development showing representative stages of anther cell differentiation (Sanders et al., 1999) are shown at the top. At stage 1 of anther development and microspore formation, rounded stamen primordia emerge with three cell layers, L1, L2 and L3. During stage 2, the archesporial cells (Ar) arise in the four “corners” of the L2 layer and the epidermis in the L1. Before meiosis the Ar cells divide and generate the primary parietal layer (1°P) and the primary sporogenous layer (1°Sp). The 1°P then divides into two secondary parietal layers (outer and inner, 2°P). The outer layer gives rise to the endothecium, the inner cells to the middle layer and the tapetum. 1°Sp produces the microspore mother cell (MMC) that undergoes meiosis and gives rise to the microspores (Alves-Ferreira et al., 2007). At stage 7, meiosis is completed and the four locules carrying tetrads (Tds) of microspores are seen. At stage 14, cells shrink and the anther dehisces liberating the pollen grains (PG; Sanders et al., 1999). Some of the known genetic interactions important during anther development are shown in purple. AG (in red) induces the expression of SPL (the first gene known to be committed to anther development); later during microsporangium formation the action of the EMS, DYT, MS1 and AMS genes is also indispensable (Feng and Dickinson, 2007). See section 3.4.6 for further explanation and Figure 15 for gene color code. Arrows and bars indicate positive and negative regulatory interactions, respectively, and dashed lines possible indirect interactions.
Figure 18.
Figure 18.
Hormones in late stages of stamen development. At stage 10 of flower development, the auxin (IAA) concentration (yellow arrow) peaks (red gradient) in the stamens. During this period filaments start to elongate and auxin prevents premature dehiscence. Auxin also participates in later anther dehiscence, probably by inducing JA production (green arrow) that peaks (dark green gradient) at stages 11 and 12 (Nagpal et al., 2005). JA coordinates filament elongation, pollen maturation, anther dehiscence and flower opening (Ishiguro et al., 2001). Although it has not been quantified, GA (blue arrow) is involved in filament elongation and participates in microsporogenesis. Pollen development in anthers of GA-biosynthetic mutants is arrested before microspore mitosis (for details see section 3.4.6; Cheng et al., 2004; Iuchi et al., 2007).
Figure 19.
Figure 19.
Main stages of carpel development and some genes involved. Three different stages of carpel development are represented by the schemes in the upper part of the figure. Briefly, at stage 6, the central zone of the FM begins to grow upward and eventually will form the gynoecium. From stages 11 to 13, the ovule primordia (O) arise from the placenta flanking the medial ridges, and the Archesporial cell (Ar) develops from a single hypodermal cell at the ovule. The Ar then forms the megaspore mother cell (MMC) through megasporogenesis, and the MMC forms the embryo sac through megagametogenesis. The embryo sac consists of 2 synergids, 1 egg cell, 1 central cell and 3 antipodal cells. The medial ridges meet in the center of the fruit to form the septum (sm) which divides the gynoecium in two internal compartments. The mature gynoecium is externally formed by the fusion of two valves (va); internally, it also carries totally differentiated ovules each one containing its own embryo sac. Carpel-specific gene networks are shown in blue. For genes and references not in the main text, see Table S1. Part of the network shown here was taken from Roeder and Yanofsky (2006) and Balanzá et al. (2006). Color codes of interactions and gene/floral organs are according to those of functional modules identified in Figure 15. Arrows and bars indicate positive and negative regulatory interactions, respectively.
Figure 20.
Figure 20.
Floral organ specification gene regulatory network (FOS-GRN) model. The diagram shows GRN topology where circles or nodes correspond to genes or proteins, and arrows and bars correspond to positive and negative regulatory interactions, respectively. The SEP node represents the SEP1, 2, and 3 genes together. The interactions are updated with respect to previous publications (Espinosa-Soto et al., 2004; Chaos et al., 2006). The GRN attractors or steady states match the gene expression profiles that characterize inflorescence meristem regions and flower organ primordia. See text and Table 1 for details and experimental data supporting this model (and Table S2 for the dynamics truth tables). Dotted lines represent interactions predicted by the model.
Figure 21.
Figure 21.
Arabidopsis inflorescence and flower development and FOS-GRN. (A) SEM colored where four regions I1, I2, I3 and I4 are distinguished within the IM. FMs are also seen arising from the flanks of the IM,1 the oldest and 5 the youngest. (B) I1, I2, I3 and I4 regions of the IM correspond to four of the FOS-GRN attractors. Expressed genes for each attractor are represented as green circles, while non-expressed genes correspond to red circles (nodes are in the same relative position as in Figure 20. * marks the position of the EMF1 node for further reference). Note that this model recovers the respective regions in the IM with both WUS and UFO, with either one of these two genes, or with neither expressed. (C) SEM colored to distinguish four types of primordial cells in young flower meristems. Each will eventually develop into the different flower organs, from the flower periphery to the center, sepals (se), petals (pe), stamens (st) and carpels (ca). (D) The six attractors of the FOS-GRN model match gene expression profiles characteristic of sepal, petal (p1 and p2), stamen (st1 and st2) and carpel primordial cells. The gene activation profiles of the attractors are congruent with the combinatorial activities of A, B, and C genes described in the ABC model of floral organ determination (adapted from Alvarez-Buylla et al., 2008).
Figure 22.
Figure 22.
Basins of attraction for the four flower organ FOS-GRN attractors. Attractors of FOS-GRN match the gene expression profiles of the four types of floral organ primordia of young floral buds (sepal, petal, stamen and carpel). The fan diagrams depict the GRN configurations (combinations of 0s and 1s corresponding to gene activation profiles) that lead to each of the attractors. Points in the outermost layers of these fan diagrams correspond to initial configurations of the network and they are linked to the transitory configurations. Petal2 and Stamen2 stand for one of the two possible attractors for each one of these organs. Relative position of nodes and their colors as in Figure 21. * marks the position of the EMF1 node for further reference.
Figure 23.
Figure 23.
Simulation results for wild type (WT) and two mutants. (A) Simplified representation of the FOS-GRN. The mutated genes are in red (nodes are in the same relative position as in Figure 20). Mutations were simulated by constitutively turning “off” (loss-of-function) mutated genes regardless of the dynamical rules. (B) Floral diagrams showing floral organs of the simulated WT and mutant plants. These correspond to the steady-state gene expression arrays (attractors) attained in the simulation. (C) Tapestries of gene configuration destinies corresponding to the simulated WT and mutant lines. In the WT simulation each square in the tapestry represents an initial condition and they are colored according to the attractor they eventually reach. In the mutant simulation for ap2 and pi, the tapestries illustrate the difference between the WT tapestry of destinies and that obtained for the mutant simulations. Yellow squares, configuration attained is the same attractor as in the WT; red squares, configurations that reached a new attractor; purple squares, configurations that attained a pre-existing attractor but not the same one reached in the WT simulations. Images generated with ATALIA (http://www.ecologia.unam.mx/~achaos/Atalia/atalia.htm).
Figure 24.
Figure 24.
The main regulatory gene modules and hormone signaling pathways during flower developmental processes. Four main developmental processes in flowers shown schematically from FM formation to mature flower formation. 1) Specification of the floral meristem anlagen. To initiate this process, FMI genes like LFV and AP1 are upregulated. However the position and polarity of these meristems are determined by other gene families and hormones like auxin (IAA) and gibberellins (GA). 2) Specification of whorls of organ primordia. The ABC identity genes and SEP are necessary and, together with other genes, sufficient to specify floral organ primordial cells (FOS-GRN module). 3) Organ primordia cell proliferation, boundary establishment and organ polarity are regulated by additional modules that are presumably coordinated during floral organ primordia formation. 4) Cellular differentiation and organ morphogenesis yield the final shape, size and tissue composition of functional sepals, petals, stamens and carpels.
Figure 25.
Figure 25.
Angiosperm phylogeny and schematic representation of ABC gene expression patterns of selected taxa. Schematic phylogeny based on APGII (2003) conventions with variations in the ABC model among angiosperm groups shown (see section 3.3). We present all rosids and asterids, but taxa comprising basal angiosperms, the magnoliid complex, monocots and core eudicots have been compacted and simplified. Arabidopsis thaliana belongs to the order Brassicales (bold and underlined). In the ABC model, the A function for sepal specification is maintained for all groups, although the class A genes involved in Arabidopsis are not functionally conserved for other taxa and may not be separable from floral meristem determination. The A function for all lineages was kept to enable comparison with Arabidopsis although a question mark was added to underline its dubious role. For B function, it should be noted that B class genes have undergone extensive duplications within different angiosperm lineages; while these duplications do not affect overall B function, on occasion they implicate subfunctionalization of the resulting paralogs (Irish and Litt, 2005; Soltis et al., 2007). For example, in species of Solanaceae such as tomato (de Martino et al., 2006) and petunia (Vandenbussche et al., 2004), and in the majority of eudicot taxa in which B function expression has been analyzed, two copies of the AP3 gene are found that have undergone subfunctionalization, AP3 and TM6. Specified floral organs are indicated underneath each ABC model (Theissen and Melzer, 2007). Abbreviations: male organs (mo); female organs (fo); sepal-like tepals (sl); petal-like tepals (pl); staminodes (sd); stamens (st); carpels (ca); petaloid tepals (te); petals (pe); palea/lemma (pa); lodicules (lo); sepals (se); sepaloid petals (sp). Symbols used to refer to compacted plant lineages are: Basal tricolpates (formula image
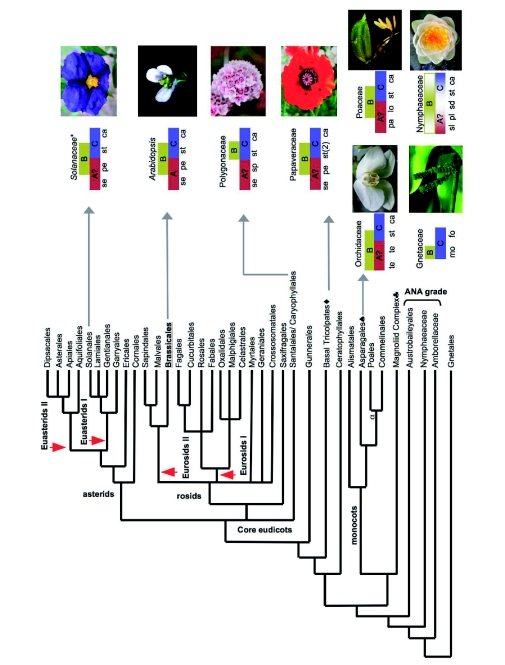
), including orders Ranunculales and Proteales and families Buxaceae, Sabiaceae and Trochodendraceae; Asparagales (formula image) including Dioscorales, Liliales and Pandanales; (a) the Commelinid grade that, in addition to Poales and Commelinales, includes Dasipogonaeae, Arecales and Zingiberales; the Magnoliid complex (formula image) including Canellales, Piperales, Laurales and Magnoliales. Images of rice spikelet, Nymphaea alba and the male Gnetum gnsmon reproductive structure were taken from Yale Virtual Centre for Cellular Expression Profiling of Rice http://bioinformatics.med.yale.edu/riceatlas/anatomy.jspx; http://commons.wikimedia.org/wiki/lmage:Nymphaea_alba.jpg and http://commons.wikimedia.org/wiki/lmage:Gnetum_gnemon_male.jpg respectively.

References

    1. Abe M., Kobayashi Y., Yamamoto S., Daimon Y., Yamaguchi A., Ikeda Y., Ichinoki H., Notaguchi M., Goto K., Araki T. FD, a bZIP protein mediating signals from the floral pathway integrator FT at the shoot apex. Science. 2005;3098(1):1052–1056. - PubMed
    1. Adam H., Jouannic S., Morcillo F., Verdeil J.L., Duvai Y., Tregear J.W. Determination of flower structure in Elaeis guineensis: do palms use the same homeotic genes as other species? Ann. Bot. 2007;1008(1):1–12. - PMC - PubMed
    1. Aida M., Ishida T., Fukaki H., Fujisawa H., Tasaka M. Genes involved in organ separation in Arabidopsis: An analysis of the cup-shaped cotyledon mutant. Plant Cell. 1997;98(1):841–857. - PMC - PubMed
    1. Aida M., Tasaka M. Morphogenesis and patterning at the organ boundaries in the higher plant shoot apex. Plant Mol. Biol. 2006a;608(1):915–928. - PubMed
    1. Aida M., Tasaka M. Genetic control of shoot organ boundaries. Curr. Opin. Plant Biol. 2006b;98(1):72–77. - PubMed

LinkOut - more resources