. 2012 Jan 3:2:90.
doi: 10.3389/fgene.2011.00090. eCollection 2011.

Whole genome sequences of a male and female supercentenarian, ages greater than 114 years

Affiliations

Whole genome sequences of a male and female supercentenarian, ages greater than 114 years

Paola Sebastiani et al. Front Genet. .

Abstract

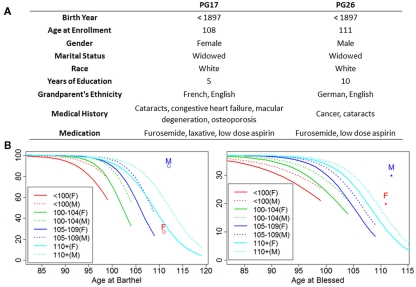
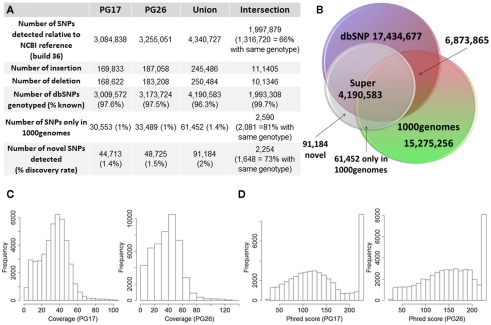
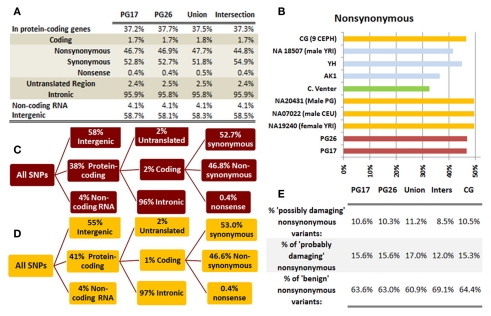
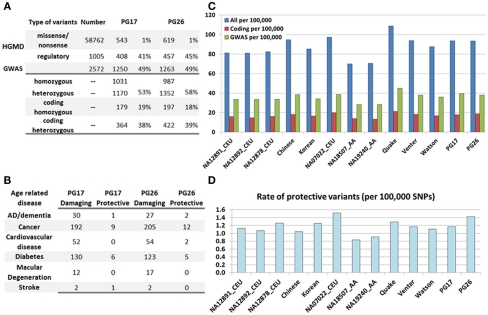
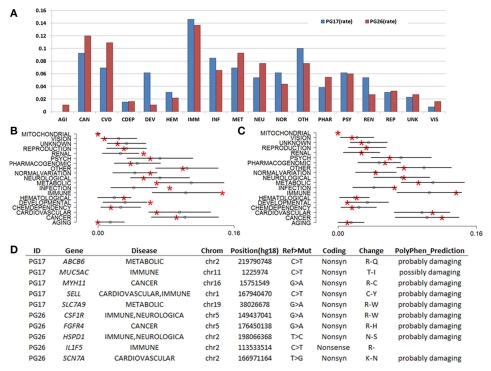
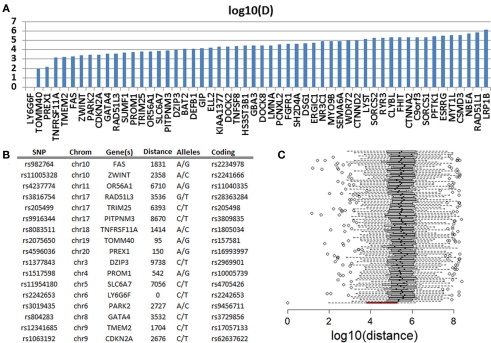
Supercentenarians (age 110+ years old) generally delay or escape age-related diseases and disability well beyond the age of 100 and this exceptional survival is likely to be influenced by a genetic predisposition that includes both common and rare genetic variants. In this report, we describe the complete genomic sequences of male and female supercentenarians, both age >114 years old. We show that: (1) the sequence variant spectrum of these two individuals' DNA sequences is largely comparable to existing non-supercentenarian genomes; (2) the two individuals do not appear to carry most of the well-established human longevity enabling variants already reported in the literature; (3) they have a comparable number of known disease-associated variants relative to most human genomes sequenced to-date; (4) approximately 1% of the variants these individuals possess are novel and may point to new genes involved in exceptional longevity; and (5) both individuals are enriched for coding variants near longevity-associated variants that we discovered through a large genome-wide association study. These analyses suggest that there are both common and rare longevity-associated variants that may counter the effects of disease-predisposing variants and extend lifespan. The continued analysis of the genomes of these and other rare individuals who have survived to extremely old ages should provide insight into the processes that contribute to the maintenance of health during extreme aging.

Keywords: aging; centenarian; genetics; longevity; supercentenarian; whole genome sequence.


Figures

Figure 1
Figure 1
Summary of patients’ characteristics. (A) The woman (PG17) had no medical history other than the births of her children until her early nineties when she had cataracts removed. She did not develop the listed diseases until the last few years of her life. Except for the surgically cured obstructing but non-metastatic colon cancer in his seventies, the man (PG26) was exceptionally healthy until the last year of his life. Ancestry was confirmed by genome-wide PCA analysis. (B) Average functional and cognitive status of the two subjects relative to other NECS subjects (M = PG26 and F = PG17). The trajectories of physical and cognitive functional declines were computed using Bayesian logistic regression of Barthel and Blessed score as explained in Andersen et al. (2011) and for each age group they are truncated by the maximum age for their defined age ranges (e.g., 99 years for nonagenarians, 104 for centenarians, 109 for semi-supercentenarians, and 119 for supercentenarians).
Figure 2
Figure 2
(A) Summary of SNPs and small insertions and deletions (Indels) detected in the two sequences, their union and intersection. The January 2011 release of the 1000 Genomes was used to compare the SNPs detected in the two sequences that were not found in dbSNP. (B) Venn diagram that illustrates the proportion of known and novel SNPs in the woman (PG17) and man (PG26) combined. (C) Distribution of effective coverage (reads used to call genotypes in CASAVA) for novel SNPs. (D) Distribution of Phred scores for the novel SNPs. The Phred scores were computed with BWA/SAMTools.
Figure 3
Figure 3
(A) functional annotation of SNPs in PG17 (female), PG26 (male), their union and intersection. Multiple transcripts of the same genes were counted individually. (B) Rate of non-synonymous SNPs in coding SNPs in PG17 and PG26 (brown) and other whole genome sequences generated at Complete Genomics (orange), Sanger (green), and Illumina (blue). CG (9 CEPH) is the average rate of non-synonymous SNPs in nine whole genome sequences generated at Complete Genomics. The rates of non-synonymous SNPs in Venter (green), AK, CH, and YRI (blue) are from publications (see Table A2 in Appendix for references). (C,D) Compare the distribution of SNPs locations and role in PG17 and PG26 (brown) and nine whole genome sequences generated at Complete Genomics (orange). (E) Provides a summary of the predicted impact of coding SNPs in PG17, PG26, their union and intersection, and the summary in nine Caucasians genotyped at complete genomics and annotated in the same way as PG17 and PG26.
Figure 4
Figure 4
(A) Summary of SNPs associated with disease in the HGMD and the GWAS catalog, and number of these SNPs and rates found in PG17 and PG26. (B) Number of SNPs in PG17 and PG26 that have either a known protective or deleterious role in major age-related diseases. (C) The bar plot shows the rate of disease-annotated variants in PG17 and PG26 and 11 other whole genome sequences. We did not include in this analysis the genomes of NA12878 and NA18507 that were sequenced with SOLID. Blue: all SNPs from HGMD and GWAS; red: only coding SNPs from HGMD; green: only SNPs from GWAS. Rates are per 100,000 SNPs. (D). Rate of protective variants in PG17 and PG26 and 11 other whole genome sequences. The major difference seems to be race related rather than subject related.
Figure 5
Figure 5
(A) Rates of genes with novel coding mutations annotated by disease. Disease groups are as in the labels of (B,C). Note that the woman did not carry any novel mutations in known aging genes, and neither of them carried novel coding SNPs in mitochondrial genes. (B) Resampling-based distributions of the rates of disease-annotated genes in PG17 when ∼400 genes were selected at random from the list of genes with coding SNPs. Red asterisks display the rate of disease-annotated genes with novel coding mutations in PG17. Distributions are based on 1,000 simulations. Error bars represent mean rate ± 2 SD. (C) Resampling-based distributions of the rates of disease-annotated genes in PG26 when ∼500 genes were selected at random in the list of genes with coding SNPs. Distributions are based on 1,000 simulations. (D) A sample of novel mutations in the female (PG17) and male (PG26). The complete list is in Table S2 in Supplementary Material.
Figure 6
Figure 6
(A) Distance in log 10 (bp) of 51 SNPs that are predictive of exceptional longevity and nearest non-referent coding SNPs in PG17 and PG26. (B) Details of the 17 SNPs that are within 10 kb from coding SNPs. (C) The box plot in red shows the distribution of log 10 (bp) distance between the longevity-associated variants and the closest coding SNPs in PG17 and PG26. The 100 box plots in white show the distributions of the distance between SNPs chosen at random from the SNPs included in the genome-wide association study in Sebastiani et al. (2012) and the closest coding SNPs in PG17 and PG26. Wiskhers extend to 1.5 SD from the quartiles and circles represent outliers.
Figure A1
Figure A1
Schematic of the mapping/alignment and variant calling steps. We used the Eland and BWA aligners to map reads to the reference genome, and CASAVA and SAMTools to call SNPs as explained in Section “Materials and Methods.” Short insertion and deletions were called using SAMTools and Dindel. Only variants that were called by both algorithms and passed quality control filters were included in the follow-up analyses.
Figure A2
Figure A2
(A) Number of SNPs called by both SNP callers, the CASAVA algorithm and SAMTools, with >99% concordant genotype calls, by chromosome. (B) Distribution of Phred scores in SNPs called in PG17 and PG26 (From SAMTools). (C) Distribution of reads used for SNPs calling in PG17 and PG26 (From CASAVA). The median number of used reads was 36 in PG17 and 43 in PG26.
Figure A3
Figure A3
Plot of the B allele frequency (a measure of heterozygosity/homozygosity) and the log R ratio (a measure of signal intensity that relates to copy number variations) using Illumina BeadStudio. The plot of B allele frequency shows that there are significant stretches of homozygosity across many chromosomes (see red arrows). However, this was not associated with a shift in log R ratio at these locations suggesting that this was not due to big deletions but probably to inbreeding of her ancestors with distant relatives that resulted in higher homozygosity.
Figure A4
Figure A4
Plot of the B allele frequency and the log R ratio in PG26. The plot of B allele frequency shows that there are no large structural variations.
Figure A5
Figure A5
Trends in QC parameters. We evaluated the effect of tighter thresholds on the minimum coverage (=number of reads) on the transition to transversion ratio (A), the heterozygous to homozygous ratios (B) and the mean depths (C). The quality parameters appear to be stable for different thresholds on minimum coverage.
Figure A6
Figure A6
Cumulative distributions of depth. The plots show the cumulative distributions of SNPs with coverage < values in the x-axes. For example, 80% of the reads in PG17 have more than 20-fold coverage.
Figure A7
Figure A7
Distribution of coverage and Phred scores of indels.
Figure A8
Figure A8
Functional analysis of the insertions detected in PG17 and PG26, their union and intersection. The chart in maroon shows the breakdown of insertions and the rate of coding insertions in PG17 and PG26. The chart in orange shows the summary of insertions in nine whole genomes generated from complete genomics and annotated in the same way as PG17 and PG26.
Figure A9
Figure A9
Functional analysis of the deletions detected in PG17 and PG26, their union and intersection. The chart in maroon shows the breakdown of deletions and the rate of coding deletions in PG17 and PG26. The chart in orange shows the summary of deletions in nine whole genomes generated from complete genomics and annotated in the same way as PG17 and PG26.
Figure A10
Figure A10
Population structure of the two supercentenarians. The two scatter plots display the principal components 1 and 2 (PCI and 2 PC2, top panels), and principal components 3 and 4 (PC3 and PC4, bottom panels) in 801 subjects from the NECS that were estimated using genome-wide data. We colored the points by one of 16 ancestral groups that were inferred using an algorithm described in Solovieff et al. (2010). The clusters were then labeled by ethnicity using the information about mother tongue and place of birth of NECS subjects and their parents. Based on the coordinates of the PCs of two subjects in the plots, we confirmed that the female had a mixed French/British ancestry, while the males had mainly a Germanic ancestry.
Figure A11
Figure A11
Genomic Coverage from ELAND. Barplots show the % of genomic coverage per chromosome when the reads were mapped to HG18 using the Illumina Elander aligner.

References

    1. Albers C. A., Lunter G., MacArthur D. G., McVean G., Ouwehand W. H., Durbin R. (2011). Dindel: accurate indel calls from short-read data. Genome Res. 21, 961–97310.1101/gr.112326.110 - DOI - PMC - PubMed
    1. Al-Regaiey K. A., Masternak M. M., Bonkowski M., Sun L., Bartke A. (2005). Long-lived growth hormone receptor knockout mice: interaction of reduced insulin-like growth factor i/insulin signaling and caloric restriction. Endocrinology 146, 851–86010.1210/en.2004-1120 - DOI - PubMed
    1. Andersen S., Sebastiani P., Dworkis D. A., Feldman L., Perls T. T. (2011). Health span approximates life span amongst many supercentenarians. J. Gerontol. A Biol. Sci. Med. Sci. [Epub ahead of print].10.1093/gerona/glr223 - DOI - PMC - PubMed
    1. Arai Y., Takayama M., Gondo Y., Inagaki H., Yamamura K., Nakazawa S., Kojima T., Ebihara Y., Shimizu K., Masui Y., Kitagawa K., Takebayashi T., Hirose N. (2008). Adipose endocrine function, insulin-like growth factor-1 axis, and exceptional survival beyond 100 years of age. J. Gerontol. A Biol. Sci. Med. Sci. 63, 1209–121810.1093/gerona/63.11.1209 - DOI - PubMed
    1. Arking D. E., Krebsova A., Macek M. Sr., Macek M., Jr., Arking A., Mian I. S., Fried L., Hamosh A., Dey S., McIntosh I., Dietz H. C. (2002). Association of human aging with a functional variant of klotho. Proc. Natl. Acad. Sci. U.S.A. 99, 856–86110.1073/pnas.022484299 - DOI - PMC - PubMed