Thousands of Novel Transcripts Identified in Mouse Cerebrum, Testis, and ES Cells Based on ribo-minus RNA Sequencing
- PMID: 22303387
- PMCID: PMC3268642
- DOI: 10.3389/fgene.2011.00093
Thousands of Novel Transcripts Identified in Mouse Cerebrum, Testis, and ES Cells Based on ribo-minus RNA Sequencing
Abstract
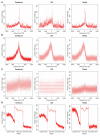
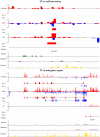
The high-throughput next-generation sequencing technologies provide an excellent opportunity for the detection of less-abundance transcripts that may not be identifiable by previously available techniques. Here, we report a discovery of thousands of novel transcripts (mostly non-coding RNAs) that are expressed in mouse cerebrum, testis, and embryonic stem (ES) cells, through an in-depth analysis of rmRNA-seq data. These transcripts show significant associations with transcriptional start and elongation signals. At the upstream of these transcripts we observed significant enrichment of histone marks (histone H3 lysine 4 trimethylation, H3K4me3), RNAPII binding sites, and cap analysis of gene expression tags that mark transcriptional start sites. Along the length of these transcripts, we also observed enrichment of histone H3 lysine 36 trimethylation (H3K36me3). Moreover, these transcripts show strong purifying selection in their genomic loci, exonic sequences, and promoter regions, implying functional constraints on the evolution of these transcripts. These results define a collection of novel transcripts in the mouse genome and indicate their potential functions in the mouse tissues and cells.
Keywords: next-generation sequencing; non-coding RNA; novel transcripts; ribo-minus RNA-seq.
Figures


Similar articles
-
Identification of H4K20me3- and H3K4me3-associated RNAs using CARIP-Seq expands the transcriptional and epigenetic networks of embryonic stem cells.J Biol Chem. 2018 Sep 28;293(39):15120-15135. doi: 10.1074/jbc.RA118.004974. Epub 2018 Aug 16. J Biol Chem. 2018. PMID: 30115682 Free PMC article.
-
A comparison between ribo-minus RNA-sequencing and polyA-selected RNA-sequencing.Genomics. 2010 Nov;96(5):259-65. doi: 10.1016/j.ygeno.2010.07.010. Epub 2010 Aug 3. Genomics. 2010. PMID: 20688152
-
Gene Expression and Gene Ontology Enrichment Analysis for H3K4me3 and H3K4me1 in Mouse Liver and Mouse Embryonic Stem Cell Using ChIP-Seq and RNA-Seq.Gene Regul Syst Bio. 2014 Jan 20;8:33-43. doi: 10.4137/GRSB.S13612. eCollection 2014. Gene Regul Syst Bio. 2014. PMID: 24526835 Free PMC article.
-
Ribosomal profiling adds new coding sequences to the proteome.Biochem Soc Trans. 2015 Dec;43(6):1271-6. doi: 10.1042/BST20150170. Biochem Soc Trans. 2015. PMID: 26614672 Review.
-
Bivalent histone modifications in early embryogenesis.Curr Opin Cell Biol. 2012 Jun;24(3):374-86. doi: 10.1016/j.ceb.2012.03.009. Epub 2012 Apr 17. Curr Opin Cell Biol. 2012. PMID: 22513113 Free PMC article. Review.
Cited by
-
The pendulum model for genome compositional dynamics: from the four nucleotides to the twenty amino acids.Genomics Proteomics Bioinformatics. 2012 Aug;10(4):175-80. doi: 10.1016/j.gpb.2012.08.002. Epub 2012 Aug 11. Genomics Proteomics Bioinformatics. 2012. PMID: 23084772 Free PMC article.
-
Comparative analyses of H3K4 and H3K27 trimethylations between the mouse cerebrum and testis.Genomics Proteomics Bioinformatics. 2012 Apr;10(2):82-93. doi: 10.1016/j.gpb.2012.05.007. Epub 2012 Jun 9. Genomics Proteomics Bioinformatics. 2012. PMID: 22768982 Free PMC article.
-
Developmental transcriptome analysis of human erythropoiesis.Hum Mol Genet. 2014 Sep 1;23(17):4528-42. doi: 10.1093/hmg/ddu167. Epub 2014 Apr 29. Hum Mol Genet. 2014. PMID: 24781209 Free PMC article.
-
Developmental analysis of spliceosomal snRNA isoform expression.G3 (Bethesda). 2014 Nov 21;5(1):103-10. doi: 10.1534/g3.114.015735. G3 (Bethesda). 2014. PMID: 25416704 Free PMC article.
-
Life on two tracks.Genomics Proteomics Bioinformatics. 2012 Jun;10(3):123-6. doi: 10.1016/j.gpb.2012.06.001. Epub 2012 Jun 23. Genomics Proteomics Bioinformatics. 2012. PMID: 22917184 Free PMC article. No abstract available.
References
-
- Bailey T. L., Elkan C. (1994). Fitting a mixture model by expectation maximization to discover motifs in biopolymers. Proc. Int. Conf. Intell. Syst. Mol. Biol. 2, 28–36 - PubMed
-
- Birney E., Stamatoyannopoulos J. A., Dutta A., Guigo R., Gingeras T. R., Margulies E. H., Weng Z., Snyder M., Dermitzakis E. T., Thurman R. E., Kuehn M. S., Taylor C. M., Neph S., Koch C. M., Asthana S., Malhotra A., Adzhubei I., Greenbaum J. A., Andrews R. M., Flicek P., Boyle P. J., Cao H., Carter N. P., Clelland G. K., Davis S., Day N., Dhami P., Dillon S. C., Dorschner M. O., Fiegler H., Giresi P. G., Goldy J., Hawrylycz M., Haydock A., Humbert R., James K. D., Johnson B. E., Johnson E. M., Frum T. T., Rosenzweig E. R., Karnani N., Lee K., Lefebvre G. C., Navas P. A., Neri F., Parker S. C., Sabo P. J., Sandstrom R., Shafer A., Vetrie D., Weaver M., Wilcox S., Yu M., Collins F. S., Dekker J., Lieb J. D., Tullius T. D., Crawford G. E., Sunyaev S., Noble W. S., Dunham I., Denoeud F., Reymond A., Kapranov P., Rozowsky J., Zheng D., Castelo R., Frankish A., Harrow J., Ghosh S., Sandelin A., Hofacker I. L., Baertsch R., Keefe D., Dike S., Cheng J., Hirsch H. A., Sekinger E. A., Lagarde J., Abril J. F., Shahab A., Flamm C., Fried C., Hackermuller J., Hertel J., Lindemeyer M., Missal K., Tanzer A., Washietl S., Korbel J., Emanuelsson O., Pedersen J. S., Holroyd N., Taylor R., Swarbreck D., Matthews N., Dickson M. C., Thomas D. J., Weirauch M. T., Gilbert J., Drenkow J., Bell I., Zhao X., Srinivasan K. G., Sung W. K., Ooi H. S., Chiu K. P., Foissac S., Alioto T., Brent M., Pachter L., Tress M. L., Valencia A., Choo S. W., Choo C. Y., Ucla C., Manzano C., Wyss C., Cheung E., Clark T. G., Brown J. B., Ganesh M., Patel S., Tammana H., Chrast J., Henrichsen C. N., Kai C., Kawai J., Nagalakshmi U., Wu J., Lian Z., Lian J., Newburger P., Zhang X., Bickel P., Mattick J. S., Carninci P., Hayashizaki Y., Weissman S., Hubbard T., Myers R. M., Rogers J., Stadler P. F., Lowe T. M., Wei C. L., Ruan Y., Struhl K., Gerstein M., Antonarakis S. E., Fu Y., Green E. D., Karaöz U., Siepel A., Taylor J., Liefer L. A., Wetterstrand K. A., Good P. J., Feingold E. A., Guyer M. S., Cooper G. M., Asimenos G., Dewey C. N., Hou M., Nikolaev S., Montoya-Burgos J. I., Löytynoja A., Whelan S., Pardi F., Massingham T., Huang H., Zhang N. R., Holmes I., Mullikin J. C., Ureta-Vidal A., Paten B., Seringhaus M., Church D., Rosenbloom K., Kent W. J., Stone E. A., NISC Comparative Sequencing Program, Baylor College of Medicine Human Genome Sequencing Center, Washington University Genome Sequencing Center, Broad Institute; Children’s Hospital Oakland Research Institute. Batzoglou S., Goldman N., Hardison R. C., Haussler D., Miller W., Sidow A., Trinklein N. D., Zhang Z. D., Barrera L., Stuart R., King D. C., Ameur A., Enroth S., Bieda M. C., Kim J., Bhinge A. A., Jiang N., Liu J., Yao F., Vega V. B., Lee C. W., Ng P., Shahab A., Yang A., Moqtaderi Z., Zhu Z., Xu X., Squazzo S., Oberley M. J., Inman D., Singer M. A., Richmond T. A., Munn K. J., Rada-Iglesias A., Wallerman O., Komorowski J., Fowler J. C., Couttet P., Bruce A. W., Dovey O. M., Ellis P. D., Langford C. F., Nix D. A., Euskirchen G., Hartman S., Urban A. E., Kraus P., Van Calcar S., Heintzman N., Kim T. H., Wang K., Qu C., Hon G., Luna R., Glass C. K., Rosenfeld M. G., Aldred S. F., Cooper S. J., Halees A., Lin J. M., Shulha H. P., Zhang X., Xu M., Haidar J. N., Yu Y., Ruan Y., Iyer V. R., Green R. D., Wadelius C., Farnham P. J., Ren B., Harte R. A., Hinrichs A. S., Trumbower H., Clawson H., Hillman-Jackson J., Zweig A. S., Smith K., Thakkapallayil A., Barber G., Kuhn R. M., Karolchik D., Armengol L., Bird C. P., de Bakker P. I., Kern A. D., Lopez-Bigas N., Martin J. D., Stranger B. E., Woodroffe A., Davydov E., Dimas A., Eyras E., Hallgrímsdóttir I. B., Huppert J., Zody M. C., Abecasis G. R., Estivill X., Bouffard G. G., Guan X., Hansen N. F., Idol J. R., Maduro V. V., Maskeri B., McDowell J. C., Park M., Thomas P. J., Young A. C., Blakesley R. W., Muzny D. M., Sodergren E., Wheeler D. A., Worley K. C., Jiang H., Weinstock G. M., Gibbs R. A., Graves T., Fulton R., Mardis E. R., Wilson R. K., Clamp M., Cuff J., Gnerre S., Jaffe D. B., Chang J. L., Lindblad-Toh K., Lander E. S., Koriabine M., Nefedov M., Osoegawa K., Yoshinaga Y., Zhu B., de Jong P. J. (2007). Identification and analysis of functional elements in 1% of the human genome by the ENCODE pilot project. Nature 447, 799–81610.1038/nature05874 - DOI - PMC - PubMed
-
- Carninci P., Kasukawa T., Katayama S., Gough J., Frith M. C., Maeda N., Oyama R., Ravasi T., Lenhard B., Wells C., Kodzius R., Shimokawa K., Bajic V. B., Brenner S. E., Batalov S., Forrest A. R., Zavolan M., Davis M. J., Wilming L. G., Aidinis V., Allen J. E., Ambesi-Impiombato A., Apweiler R., Aturaliya R. N., Bailey T. L., Bansal M., Baxter L., Beisel K. W., Bersano T., Bono H., Chalk A. M., Chiu K. P., Choudhary V., Christoffels A., Clutterbuck D. R., Crowe M. L., Dalla E., Dalrymple B. P., De Bono B., Della Gatta G., Di Bernardo D., Down T., Engstrom P., Fagiolini M., Faulkner G., Fletcher C. F., Fukushima T., Furuno M., Futaki S., Gariboldi M., Georgii-Hemming P., Gingeras T. R., Gojobori T., Green R. E., Gustincich S., Harbers M., Hayashi Y., Hensch T. K., Hirokawa N., Hill D., Huminiecki L., Iacono M., Ikeo K., Iwama A., Ishikawa T., Jakt M., Kanapin A., Katoh M., Kawasawa Y., Kelso J., Kitamura H., Kitano H., Kollias G., Krishnan S. P., Kruger A., Kummerfeld S. K., Kurochkin I. V., Lareau L. F., Lazarevic D., Lipovich L., Liu J., Liuni S., Mcwilliam S., Madan Babu M., Madera M., Marchionni L., Matsuda H., Matsuzawa S., Miki H., Mignone F., Miyake S., Morris K., Mottagui-Tabar S., Mulder N., Nakano N., Nakauchi H., Ng P., Nilsson R., Nishiguchi S., Nishikawa S., Piazza S., Reed J., Reid J. F., Ring B. Z., Ringwald M., Rost B., Ruan Y., Salzberg S. L., Sandelin A., Schneider C., Schönbach C., Sekiguchi K., Semple C. A., Seno S., Sessa L., Sheng Y., Shibata Y., Shimada H., Shimada K., Silva D., Sinclair B., Sperling S., Stupka E., Sugiura K., Sultana R., Takenaka Y., Taki K., Tammoja K., Tan S. L., Tang S., Taylor M. S., Tegner J., Teichmann S. A., Ueda H. R., van Nimwegen E., Verardo R., Wei C. L., Yagi K., Yamanishi H., Zabarovsky E., Zhu S., Zimmer A., Hide W., Bult C., Grimmond S. M., Teasdale R. D., Liu E. T., Brusic V., Quackenbush J., Wahlestedt C., Mattick J. S., Hume D. A., Kai C., Sasaki D., Tomaru Y., Fukuda S., Kanamori-Katayama M., Suzuki M., Aoki J., Arakawa T., Iida J., Imamura K., Itoh M., Kato T., Kawaji H., Kawagashira N., Kawashima T., Kojima M., Kondo S., Konno H., Nakano K., Ninomiya N., Nishio T., Okada M., Plessy C., Shibata K., Shiraki T., Suzuki S., Tagami M., Waki K., Watahiki A., Okamura-Oho Y., Suzuki H., Kawai J., Hayashizaki Y., FANTOM Consortium, and RIKEN Genome Exploration Research Group and Genome Science Group (Genome Network Project Core Group) (2005). The transcriptional landscape of the mammalian genome. Science 309, 1559–156310.1126/science.1112014 - DOI - PubMed
LinkOut - more resources
Full Text Sources
Miscellaneous

