. 2012;7(1):e30855.
doi: 10.1371/journal.pone.0030855. Epub 2012 Jan 27.

Nipah virus infects specific subsets of porcine peripheral blood mononuclear cells

Affiliations

Nipah virus infects specific subsets of porcine peripheral blood mononuclear cells

Beata Stachowiak et al. PLoS One. 2012.

Abstract

Nipah virus (NiV), a zoonotic paramyxovirus, is highly contagious in swine, and can cause fatal infections in humans following transmission from the swine host. The main viral targets in both species are the respiratory and central nervous systems, with viremia implicated as a mode of dissemination of NiV throughout the host. The presented work focused on the role of peripheral blood mononuclear cells (PBMC) in the viremic spread of the virus in the swine host. B lymphocytes, CD4-CD8-, as well as CD4+CD8- T lymphocytes were not permissive to NiV, and expansion of the CD4+CD8- cells early post infection was consistent with functional humoral response to NiV infection observed in swine. In contrast, significant drop in the CD4+CD8- T cell frequency was observed in piglets which succumbed to the experimental infection, supporting the hypothesis that antibody development is the critical component of the protective immune response. Productive viral replication was detected in monocytes, CD6+CD8+ T lymphocytes and NK cells by recovery of infectious virus in the cell supernatants. Virus replication was supported by detection of the structural N and the non-structural C proteins or by detection of genomic RNA increase in the infected cells. Infection of T cells carrying CD6 marker, a strong ligand for the activated leukocyte cell adhesion molecule ALCAM (CD166) highly expressed on the microvascular endothelial cell of the blood-air and the blood-brain barrier may explain NiV preferential tropism for small blood vessels of the lung and brain.


Conflict of interest statement

Competing Interests: The authors have declared that no competing interests exist.

Figures

Figure 1
Figure 1. Flow chart of sorting and staining of PBMC.
Sorting of cell subpopulations from peripheral blood mononuclear cells (PBMC) by magnetic beads coated with antibodies against selected markers ( Fig. 1A ), and staining of PBMC for CD4 and CD8 markers for analysis by flow cytometry ( Fig. 1B ). (hi) indicates high density expression of a specific marker, and (lo) indicates low density expression.
Figure 2
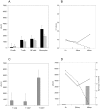
Figure 2. Replication of NiV in the individual subpopulations of PBMC.
Sorted cells were inoculated with NiV in three independent experiments. Total of 105cells per subpopulation were inoculated with 104 PFU of NiV in one 1 ml volume. The infectivity in cell supernatants was determined by plaque titration on Vero 76 cells. Fig. 2.A Comparison of virus yield from stimulated and non-stimulated PBMC subpopulations at 48 hrs post inoculation. Black filled columns represent mean of pfu/ml in supernatant collected from non-stimulated cells, the grey filled columns represent mean of pfu/ml in supernatant collected from stimulated lymphocytes or monocytes. Purity of the individual cell preparations was in the following range: B cells - 75 to 85%, CD6+ T cells - 90 to 95%, CD4+ T cells - 85%, CD3+CD8+ T cells - 95%, NK cells – 80 to 85%, monocytes - close to 100%. Fig. 2.B Presence of genomic RNA at indicated time points post inoculation in cell lysates from monocytes inoculated with live NiV (solid line) or with gamma-irradiated NiV (dashed line). Fig. 2.C NiV yield in supernatants of sorted T lymphocytes at 24 hrs post inoculation. Fig. 2.D Detection of infectivity in supernatant harvested from monocytes at 24 and 48 hrs post inoculation with NiV (gray columns), and detection of viral RNA in cells inoculated with live virus (solid black line) or with gamma-irradiated NiV (black dashed line).
Figure 3
Figure 3. Intracellular staining for NiV nucleocapsid N or non-structural C protein in T cells.
The cells were sorted based on the presence of CD4, CD6 or CD3CD8 markers, and infected with NiV at 0.1 moi. Representative flow cytometry histograms were selected from three independent experiments. Fig. 3.A Lack of intracellular staining for NiV non-structural C protein in CD4+ T cells at 24 hrs post inoculation. Fig. 3.B Intracellular staining for NiV C protein in CD3+CD8+ T cells at 24 hrs post inoculation. At 48 hrs post inoculation/infection about 30% of the CD3+CD8+ stained internally for the NiV C protein ( Fig. 3.D ), confirmed by about 30% of CD6+ T cells stained internally for the NiV nucleocapsid N protein ( Fig. 3.C ).
Figure 4
Figure 4. NiV infected CD6+ T cells triple stained for CD4 and CD8 markers, and NiV antigen.
Dot plot of flow cytometry analysis of NiV infected CD6+ T cells, triple stained with monoclonal antibodies against CD4 and CD8 markers, and NiV polyclonal guinea pig antiserum 24 hrs post infection. T cells gated for CD8+ and NiV antigen ( Fig. 4.A ). T cells gated for CD4+ and NiV staining ( Fig. 4.B ). Analysis of cells positively stained for CD8+ and NiV antigen indicated that only low percentage (about 10%) was also positive for CD4 marker ( Fig. 4.C ). Analysis of cells positively stained for CD4+ and NiV antigen indicated that they were all positive for CD8 ( Fig. 4.D ) marker. In summary, cells with CD8 marker, whether CD4+CD8+ or CD4−CD8+ were the ones staining also for NiV antigen.
Figure 5
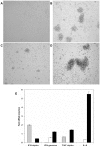
Figure 5. Stimulation of T cells with PMA/ionomycin and/or NiV infection.
Figs. 5.A–5.D illustrate changes in cell appearance of the CD6+ T cells after 18 hrs post infection with NiV at 0.1 moi. Formation of cell clusters in NiV infected cells suggests that the infection stimulates T lymphocytes. Appearance of non-stimulated T cells ( Fig. 5.A ) in comparison to NiV infected T cells ( Fig. 5.B ) and the PMA/ionomycin stimulated cells ( Fig. 5.C ). NiV infected PMA/ionomycin activated T cells ( Fig. 5.D ). Fig. 5.E Cytokine RNA profiles were determined 48 hrs post incubation/infection by quantitative RT-PCR. Gray columns represent ratio of PMA/ionomycin activated cells and non-stimulated T cells; white columns represent ratio of NiV infected cells compare to non-stimulated cells; black columns represent ratio of infected PMA/ionomycin activated cells compared to PMA/ionomycin activated T cells.
Figure 6
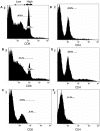
Figure 6. Changes in population frequencies of CD8+ and CD4+ cells following NiV in vitro inoculation of PBMC.
Fig. 6.A PBMC control after 24 hrs incubation stained for CD8 marker. Thin arrow on top of the figure indicates CD8 αβlo T cells. The highest intensity peak corresponds to CD8 αβhi T cells (cytolytic T cells) indicated by the bold arrow. Fig. 6.B NiV infected PBMC stained for CD8 marker at 24 hrs post inoculation. Fig. 6.C At 48 hrs post inoculation, the peak corresponding with CD8 αβhi T cells was absent, and the proportion of CD8+ cells decreased from 40% to about 20%. Fig. 6.D PBMC control stained for the CD4 marker after 24 hrs incubation. Fig. 6.E Cells inoculated with NiV stained at 24 hrs post inoculation for CD4 marker. Fig. 6.F Decrease in CD4+ cells from 20% in the control uninfected PBMC to about 10% at 48 hrs post inoculation with NiV.
Figure 7
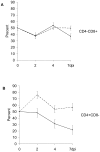
Figure 7. T cell subpopulation frequencies in NiV infected pigs during the acute phase of the infection.
Changes in CD4D8 cell subpopulation frequencies in PBMC of pigs infected with NiV based on flow cytometry analysis. The values obtained at 0 dpi were arbitrarily set at 50%. The data (mean and standard error) are based on six infected (solid line) and 4 control (dashed line) animals. Notably, significant changes with opposite trends were observed for CD4−CD8+ T cells ( Fig. 7.A ), and CD4+ CD8− T cells ( Fig. 7.B ). The changes in CD4+CD8+ T cell frequency, although statistically significant, were only minor, perhaps with slight decline toward the 7 dpi in the infected piglets compared to the controls ( Fig. 7.C ).
Figure 8
Figure 8. Comparison of T cell subpopulations between pigs that died during acute infection versus survivors.
The differences in CD4+ and CD8+ cell subpopulations during the acute infection with NiV up to 7 dpi. Values, based on flow cytometry analysis, were arbitrarily set as 50% at 0 dpi. The solid line represents piglets that died at 7 dpi, the dashed line represents the survivors. Standard Error is represented as error bars for 2 pigs per each group/mean value. Survivors had significantly higher values for the CD4−CD8+ ( Fig. 8.A ) at 7 dpi compare to the piglets which died at that day. Marked difference was observed for the CD4+CD8− T lymphocytes ( Fig. 8.B ). The down-trend starting almost immediately post infection for this cell subpopulation in pigs that died due to NiV infection was especially pronounced. In contrast, there was an up-regulation of CD4+CD8− T helper cells at 2 dpi in the survivors.
Figure 9
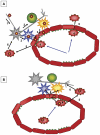
Figure 9. Proposed microvascular component of brain invasion by NiV in swine.
Fig.9.A . NiV invasion of the central nervous system (CNS) initiated in the nasal cavity leads to virus spread into the brain via neurons . NiV infects cells in contact with neurons: oligodendrocytes, astrocytes and microglia . Astrocytes and microglia are in a direct contact with microvascular endothelial cells (MEC), allowing for direct NiV iter-cellular transmission and infection of the MEC . Infected astrocytes, microglia and MEC recruit leukocytes by release of cytokines (blue arrows). From the incoming leukocytes, the CD6+ T cells can firmly attach to the MEC via the CD6-CD166/ALCAM interaction , form transmigration cup, and translocate into the brain parenchyma. (The NK cells and monocytes have low expression of the ALCAM on their surface, and can also transmigrate into the brain. Since the ALCAM-ALCAM interaction is weaker then CD6-ALCAM one, this may be a later event.) The translocating leukocytes can get infected during the transmigration due to intimate contact with NiV infected MEC , and spread the virus to the parenchymal cells in the brain , thus initiating the CNS invasion via BBB. Fig. 9.B . Alternatively, the recruited lymphocytes can be already infected with NiV. By forming the transmigration cap , they can during transmigration infect the MEC , spreading subsequently the virus to the in-contact astrocytes and microglia , and/or after transmigration across the BBB infect additional parenchymal cells . This mechanism initiates the CNS infection, due to the virus crossing the BBB, and can also apply to invasion of the brain by NiV in other hosts then pigs. Gray star - neuron, blue star - astrocyte, green circle - oligodendrocytes, yellow star - microglia, small brown stars with yellow center - NiV, dark red ovals adjacent to each other - MEC forming the BBB, green dots - schematic representation of the ALCAM, light centered reddish ovals - T lymphocytes with CD6+ markers (dark brown dots), blue arrows - transmigration of leukocytes across the BBB, black arrows - NiV spread.

Similar articles

Cited by

References

    1. Wang L, Harcourt BH, Yu M, Tamin A, Rota PA, et al. Molecular biology of Hendra and Nipah viruses. Microbes Infect. 2001;3:279–287. - PubMed
    1. Chua KB. Nipah virus outbreak in Malaysia. J Clin Virol. 2003;26:265–275. - PubMed
    1. Hossain MJ, Gurley ES, Montgomery JM, Bell M, Carroll DS, et al. Clinical presentation of Nipah virus infection in Bangladesh. Clin Infect Dis. 2008;46:977–984. - PubMed
    1. Chua KB, Bellini WJ, Rota PA, Harcourt BH, Tamin A, et al. Nipah virus: a recently emergent deadly paramyxovirus. Science. 2000;288:1432–1435. - PubMed
    1. Mohd Nor MN, Gan CH, Ong BL. Nipah virus infection of pigs in peninsular Malaysia. Rev Sci Tech. 2000;19:160–165. - PubMed

Publication types

MeSH terms