

A G-rich element forms a G-quadruplex and regulates BACE1 mRNA alternative splicing
- PMID: 22303960
- PMCID: PMC3342435
- DOI: 10.1111/j.1471-4159.2012.07680.x
A G-rich element forms a G-quadruplex and regulates BACE1 mRNA alternative splicing
Abstract
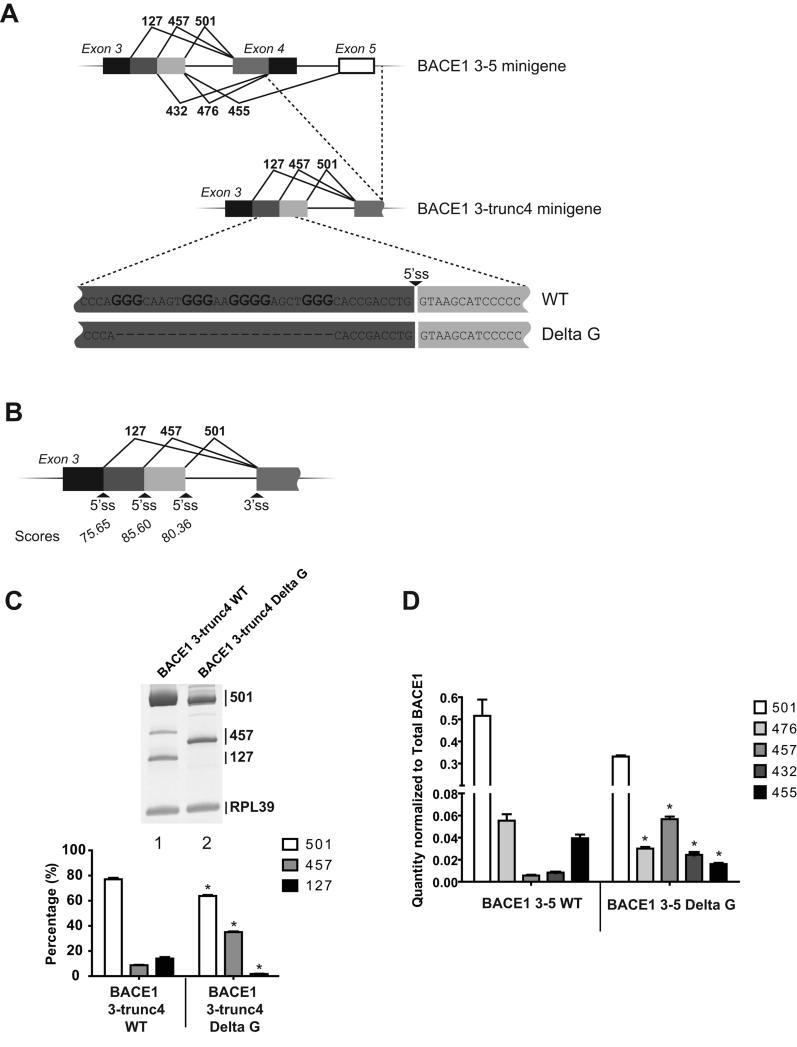
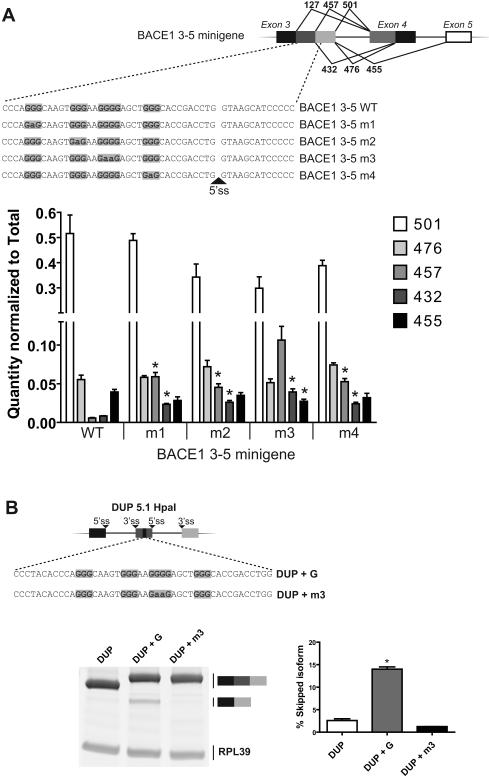
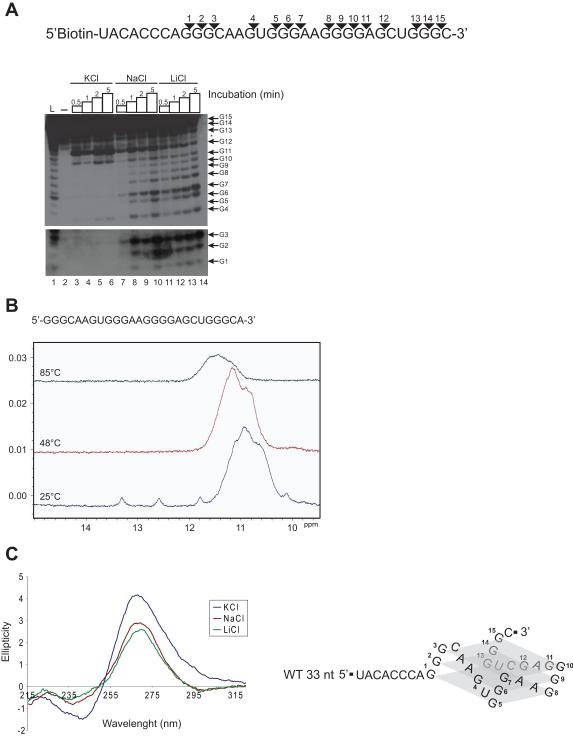
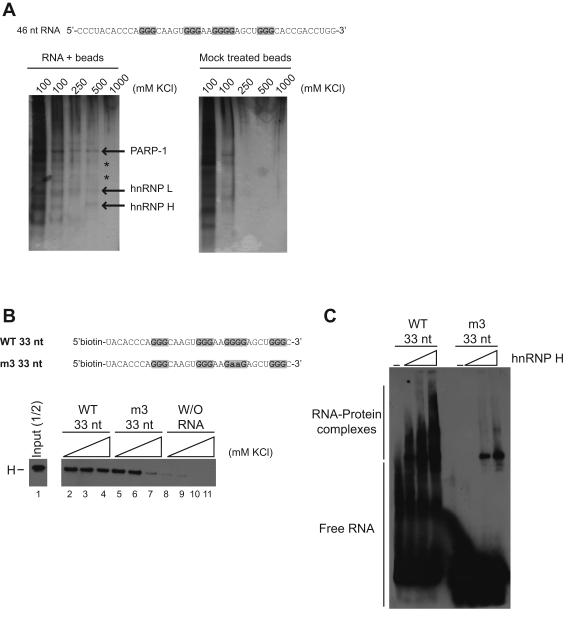
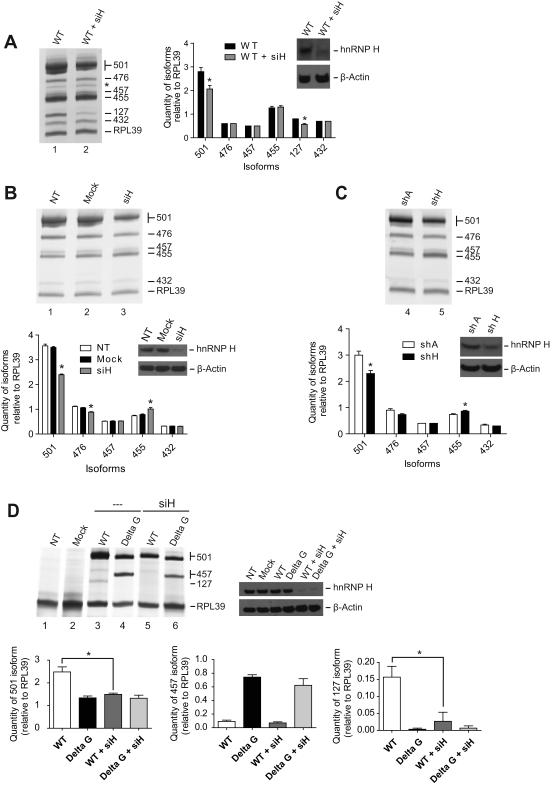
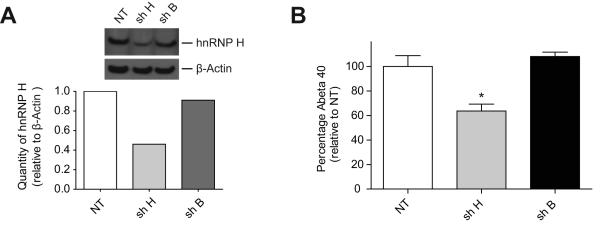
β-Site amyloid precursor protein (APP) cleaving enzyme 1 (BACE1) is the transmembrane aspartyl protease that catalyzes the first cleavage step in the proteolysis of the APP to the amyloid β-protein (Aβ), a process involved in the pathogenesis of Alzheimer disease. BACE1 pre-mRNA undergoes complex alternative splicing, the regulation of which is not well understood. We identified a G-rich sequence within exon 3 of BACE1 involved in controlling splice site selection. Mutation of the G-rich sequence decreased use of the normal 5' splice site of exon 3, which leads to full-length and proteolytically active BACE1, and increased use of an alternative splice site, which leads to a shorter, essentially inactive isoform. Nuclease protection assays, nuclear magnetic resonance, and circular dichroism spectroscopy revealed that this sequence folds into a G-quadruplex structure. Several proteins were identified as capable of binding to the G-rich sequence, and one of these, heterogeneous nuclear ribonucleoprotein H, was found to regulate BACE1 exon 3 alternative splicing and in a manner dependent on the G-rich sequence. Knockdown of heterogeneous nuclear ribonucleoprotein H led to a decrease in the full-length BACE1 mRNA isoform as well as a decrease in Aβ production from APP, suggesting new possibilities for therapeutic approaches to Alzheimer's disease.
© 2012 The Authors. Journal of Neurochemistry © 2012 International Society for Neurochemistry.
Figures
Comment in
-
Targeting pre-mRNA splicing: a BACE-ic strategy for AD drug development?J Neurochem. 2012 Jun;121(5):695-6. doi: 10.1111/j.1471-4159.2012.07679.x. J Neurochem. 2012. PMID: 22303926 No abstract available.
Similar articles
-
Identification of a cis-acting element involved in the regulation of BACE1 mRNA alternative splicing.J Neurochem. 2009 May;109(4):1008-16. doi: 10.1111/j.1471-4159.2009.06026.x. Epub 2009 Mar 3. J Neurochem. 2009. PMID: 19302194
-
Promotion of BACE1 mRNA alternative splicing reduces amyloid beta-peptide production.J Biol Chem. 2008 Jul 4;283(27):18694-701. doi: 10.1074/jbc.M801322200. Epub 2008 May 8. J Biol Chem. 2008. PMID: 18468996
-
Alternative Selection of β-Site APP-Cleaving Enzyme 1 (BACE1) Cleavage Sites in Amyloid β-Protein Precursor (APP) Harboring Protective and Pathogenic Mutations within the Aβ Sequence.J Biol Chem. 2016 Nov 11;291(46):24041-24053. doi: 10.1074/jbc.M116.744722. Epub 2016 Sep 29. J Biol Chem. 2016. PMID: 27687728 Free PMC article.
-
The proteins BACE1 and BACE2 and beta-secretase activity in normal and Alzheimer's disease brain.Biochem Soc Trans. 2007 Jun;35(Pt 3):574-6. doi: 10.1042/BST0350574. Biochem Soc Trans. 2007. PMID: 17511655 Review.
-
The beta-secretase, BACE: a prime drug target for Alzheimer's disease.J Mol Neurosci. 2001 Oct;17(2):157-70. doi: 10.1385/JMN:17:2:157. J Mol Neurosci. 2001. PMID: 11816789 Review.
Cited by
-
Decoding a cancer-relevant splicing decision in the RON proto-oncogene using high-throughput mutagenesis.Nat Commun. 2018 Aug 17;9(1):3315. doi: 10.1038/s41467-018-05748-7. Nat Commun. 2018. PMID: 30120239 Free PMC article.
-
Synthesis, Binding and Antiviral Properties of Potent Core-Extended Naphthalene Diimides Targeting the HIV-1 Long Terminal Repeat Promoter G-Quadruplexes.J Med Chem. 2015 Dec 24;58(24):9639-52. doi: 10.1021/acs.jmedchem.5b01283. Epub 2015 Dec 8. J Med Chem. 2015. PMID: 26599611 Free PMC article.
-
Application of G-quadruplex targets in gastrointestinal cancers: Advancements, challenges and prospects.World J Gastrointest Oncol. 2023 Jul 15;15(7):1149-1173. doi: 10.4251/wjgo.v15.i7.1149. World J Gastrointest Oncol. 2023. PMID: 37546556 Free PMC article. Review.
-
Nucleolin stabilizes G-quadruplex structures folded by the LTR promoter and silences HIV-1 viral transcription.Nucleic Acids Res. 2015 Oct 15;43(18):8884-97. doi: 10.1093/nar/gkv897. Epub 2015 Sep 9. Nucleic Acids Res. 2015. PMID: 26354862 Free PMC article.
-
Structure and target interaction of a G-quadruplex RNA-aptamer.RNA Biol. 2016 Oct 2;13(10):973-987. doi: 10.1080/15476286.2016.1212151. Epub 2016 Jul 29. RNA Biol. 2016. PMID: 27471797 Free PMC article.
References
-
- Caputi M, Zahler AM. Determination of the RNA binding specificity of the heterogeneous nuclear ribonucleoprotein (hnRNP) H/H’/F/2H9 family. J Biol Chem. 2001;276:43850–43859. - PubMed
Publication types
MeSH terms
Substances
Grants and funding
LinkOut - more resources
Full Text Sources
