

Overexpression of mouse TTF-2 gene causes cleft palate
- PMID: 22304410
- PMCID: PMC3823429
- DOI: 10.1111/j.1582-4934.2012.01546.x
Overexpression of mouse TTF-2 gene causes cleft palate
Abstract
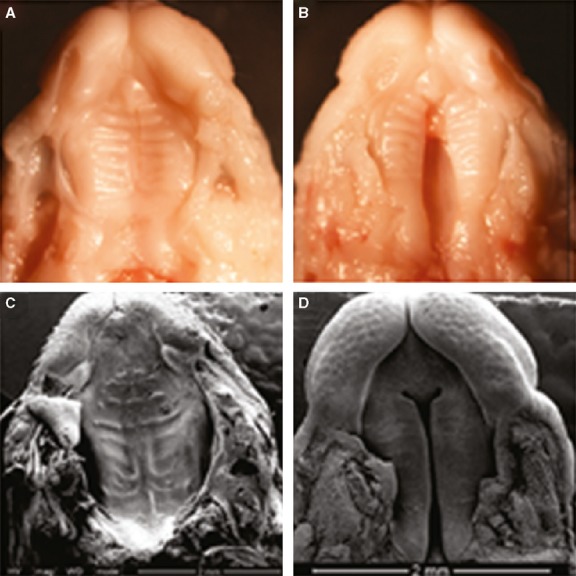
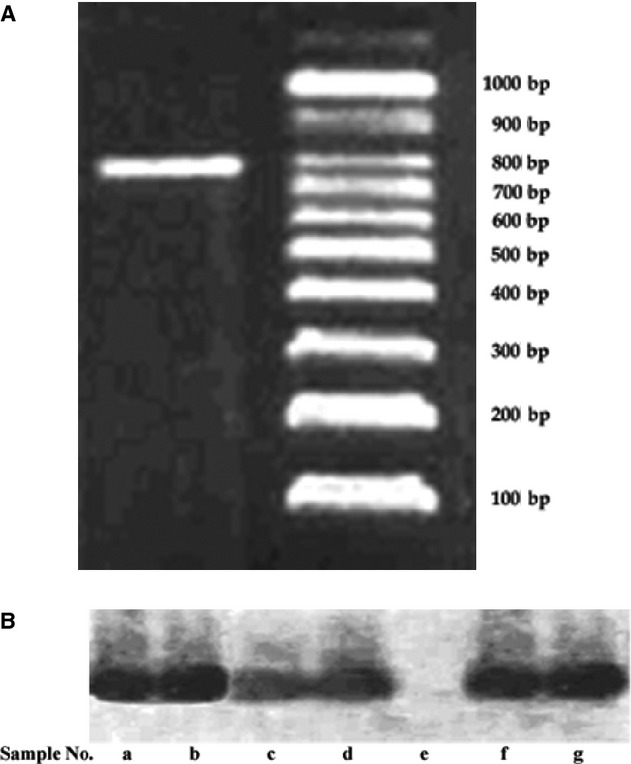
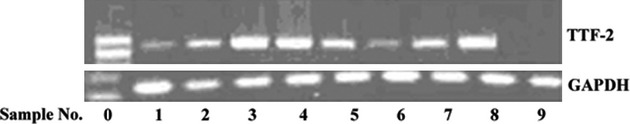
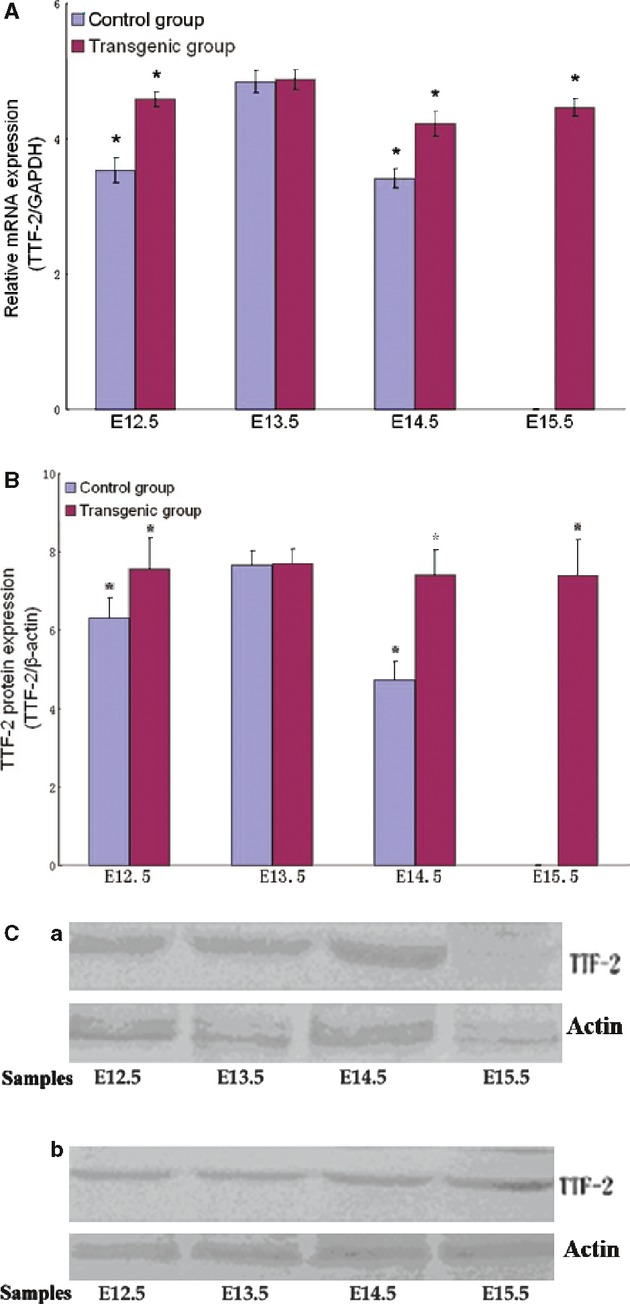
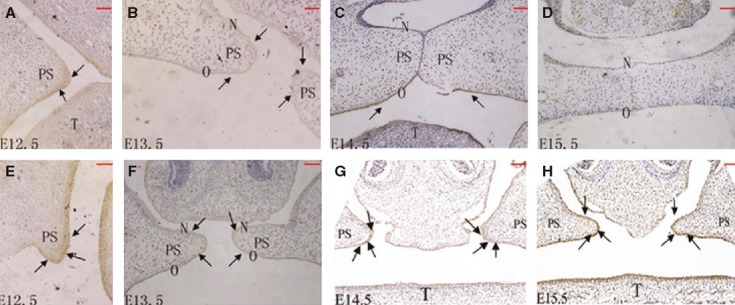
In humans, mutations of the gene encoding for thyroid transcription factor-2 (TTF-2 or FOXE1) result in Bamforth syndrome. Bamforth syndrome is characterized by agenesis, cleft palate, spiky hair and choanal atresia. TTF-2 null mice (TTF-2(-/-) ) also exhibit cleft palate, suggesting its involvement in the palatogenesis. However, the molecular pathology and genetic regulation by TTF2 remain largely unknown. In the present study, the recombinant expression vector pBROAD3-TTF-2 containing the promoter of the mouse ROSA26 gene was created to form the structural gene of mouse TTF-2 and was microinjected into the male pronuclei of fertilized ova. Sequence analysis confirmed that the TTF-2 transgenic mouse model was established successfully. The transgenic mice displayed a phenotype of cleft palate. In addition, we found that TTF-2 was highly expressed in the medial edge epithelium (MEE) from the embryonic day 12.5 (E12.5) to E14.5 in TTF-2 transgenic mice. These observations suggest that overexpression of TTF-2 during palatogenesis may contribute to formation of cleft palate.
© 2012 The Authors Journal of Cellular and Molecular Medicine © 2012 Foundation for Cellular and Molecular Medicine/Blackwell Publishing Ltd.
Figures
Similar articles
-
[Biological characteristics of cleft palate relevant gene thyroid transcription factor-2 transgenic mice].Hua Xi Kou Qiang Yi Xue Za Zhi. 2014 Aug;32(4):345-9. doi: 10.7518/hxkq.2014.04.007. Hua Xi Kou Qiang Yi Xue Za Zhi. 2014. PMID: 25241534 Free PMC article. Chinese.
-
Distribution of the titf2/foxe1 gene product is consistent with an important role in the development of foregut endoderm, palate, and hair.Dev Dyn. 2002 Aug;224(4):450-6. doi: 10.1002/dvdy.10118. Dev Dyn. 2002. PMID: 12203737
-
A novel FOXE1 mutation (R73S) in Bamforth-Lazarus syndrome causing increased thyroidal gene expression.Thyroid. 2014 Apr;24(4):649-54. doi: 10.1089/thy.2013.0417. Epub 2014 Jan 23. Thyroid. 2014. PMID: 24219130 Free PMC article.
-
Spectrum of Human Foxe1/TTF2 Mutations.Horm Res Paediatr. 2010;73(6):423-9. doi: 10.1159/000281438. Epub 2010 May 6. Horm Res Paediatr. 2010. PMID: 20453517 Review.
-
Biological mechanisms in palatogenesis and cleft palate.J Dent Res. 2009 Jan;88(1):22-33. doi: 10.1177/0022034508327868. J Dent Res. 2009. PMID: 19131313 Review.
Cited by
-
A single nucleotide polymorphism associated with isolated cleft lip and palate, thyroid cancer and hypothyroidism alters the activity of an oral epithelium and thyroid enhancer near FOXE1.Hum Mol Genet. 2015 Jul 15;24(14):3895-907. doi: 10.1093/hmg/ddv047. Epub 2015 Feb 4. Hum Mol Genet. 2015. PMID: 25652407 Free PMC article.
-
Mouse embryonic palatal mesenchymal cells maintain stemness through the PTEN-Akt-mTOR autophagic pathway.Stem Cell Res Ther. 2019 Jul 29;10(1):217. doi: 10.1186/s13287-019-1340-8. Stem Cell Res Ther. 2019. PMID: 31358051 Free PMC article.
-
Identification of functional non-coding variants associated with orofacial cleft.Nat Commun. 2025 Jul 16;16(1):6545. doi: 10.1038/s41467-025-61734-w. Nat Commun. 2025. PMID: 40670354 Free PMC article.
-
Wnt6 influences the viability of mouse embryonic palatal mesenchymal cells via the β-catenin pathway.Exp Ther Med. 2017 Dec;14(6):5339-5344. doi: 10.3892/etm.2017.5240. Epub 2017 Oct 2. Exp Ther Med. 2017. PMID: 29285061 Free PMC article.
-
Association analysis of GWAS hits and non-syndromic cleft lip with/without palate with cleft alveolar in Han population of western China.Int J Clin Exp Pathol. 2020 Oct 1;13(10):2576-2585. eCollection 2020. Int J Clin Exp Pathol. 2020. PMID: 33165418 Free PMC article.
References
-
- Ferguson MW. Palate development. Development. 1988;103:41–60. - PubMed
-
- Cuervo R, Covarrubias L. Death is the major fate of medial edge epithelial cells and the cause of basal lamina degradation during palatogenesis. Development. 2004;131:15–24. - PubMed
-
- Mori C, Nakamura N, Okamoto Y, et al. Cytochemical identification of programmed cell death in the fusing fetal mouse palate by specific labeling of DNA fragmentation. Anat Embryol. 1994;190:21–8. - PubMed
-
- Taniguchi K, Sato N, Uchiyama Y. Apoptosis and heterophagy of medial edge epithelial cells of the secondary palatine shelves during fusion. Arch Histol Cytol. 1995;58:191–203. - PubMed
-
- Fitchett JE, Hay ED. Medial edge epithelium transforms to mesenchyme after embryonic palatal shelves fuse. Dev Biol. 1989;131:455–74. - PubMed
Publication types
MeSH terms
Substances
LinkOut - more resources
Full Text Sources
Medical
Molecular Biology Databases
