. 2012 Apr 6;11(4):2282-300.
doi: 10.1021/pr201070k. Epub 2012 Mar 7.

N-linked glycan structures and their expressions change in the blood sera of ovarian cancer patients

Affiliations

N-linked glycan structures and their expressions change in the blood sera of ovarian cancer patients

William R Alley Jr et al. J Proteome Res. .

Abstract

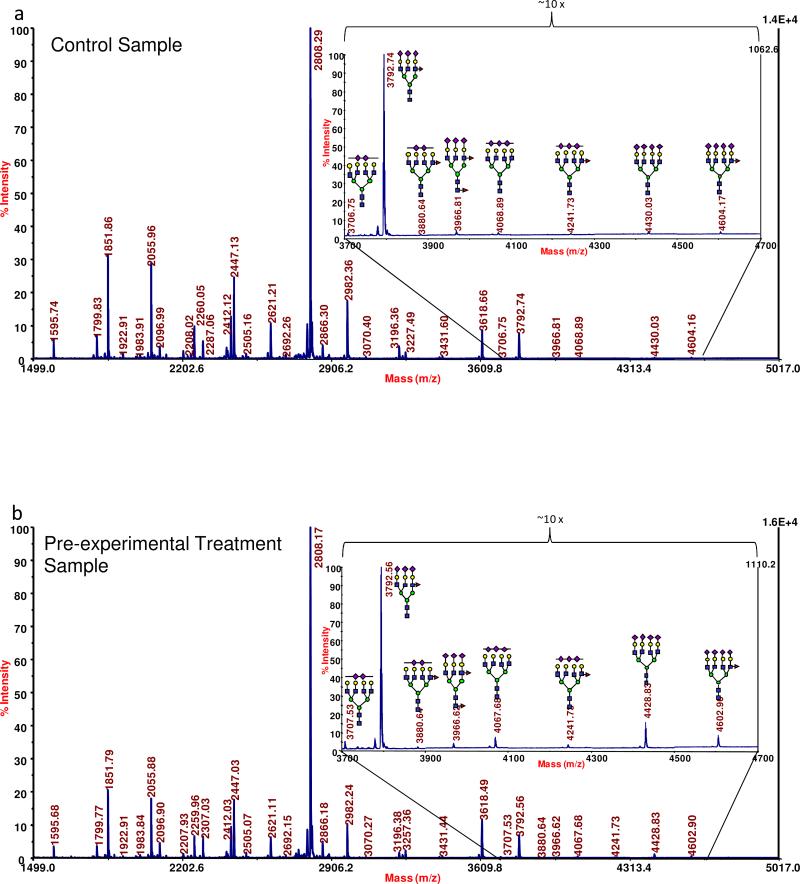
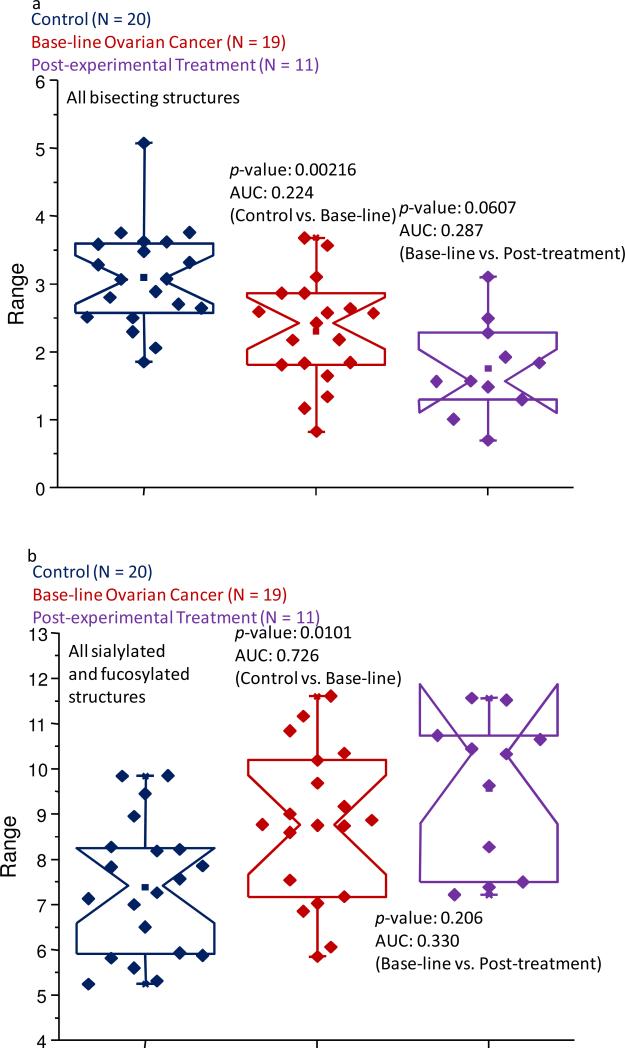
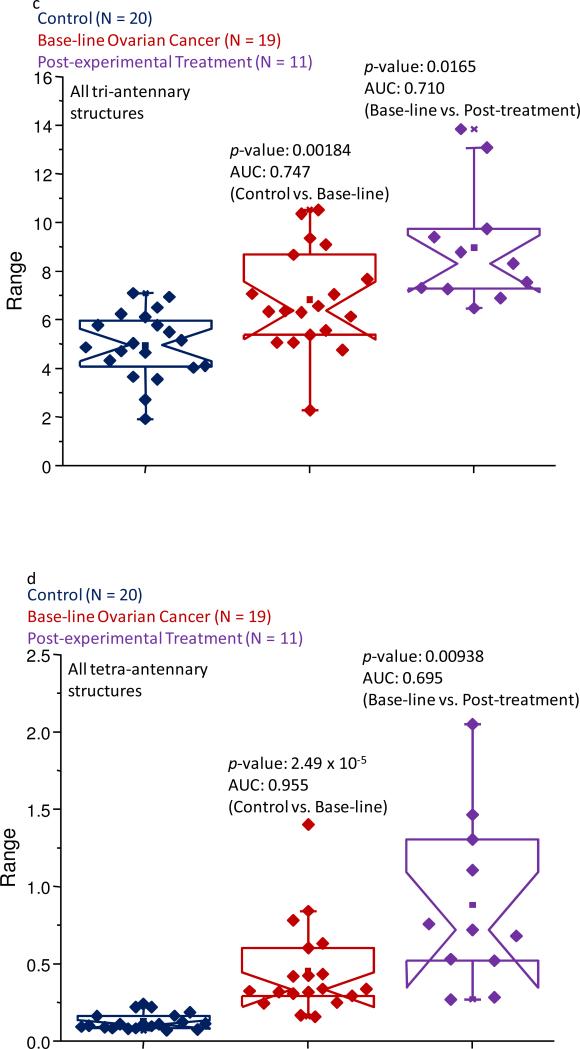
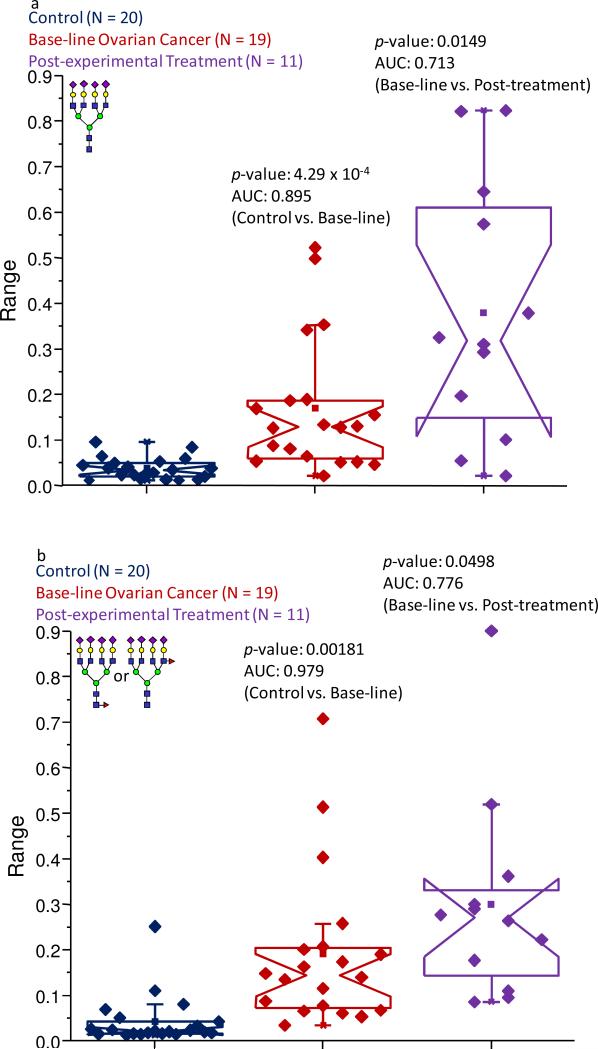
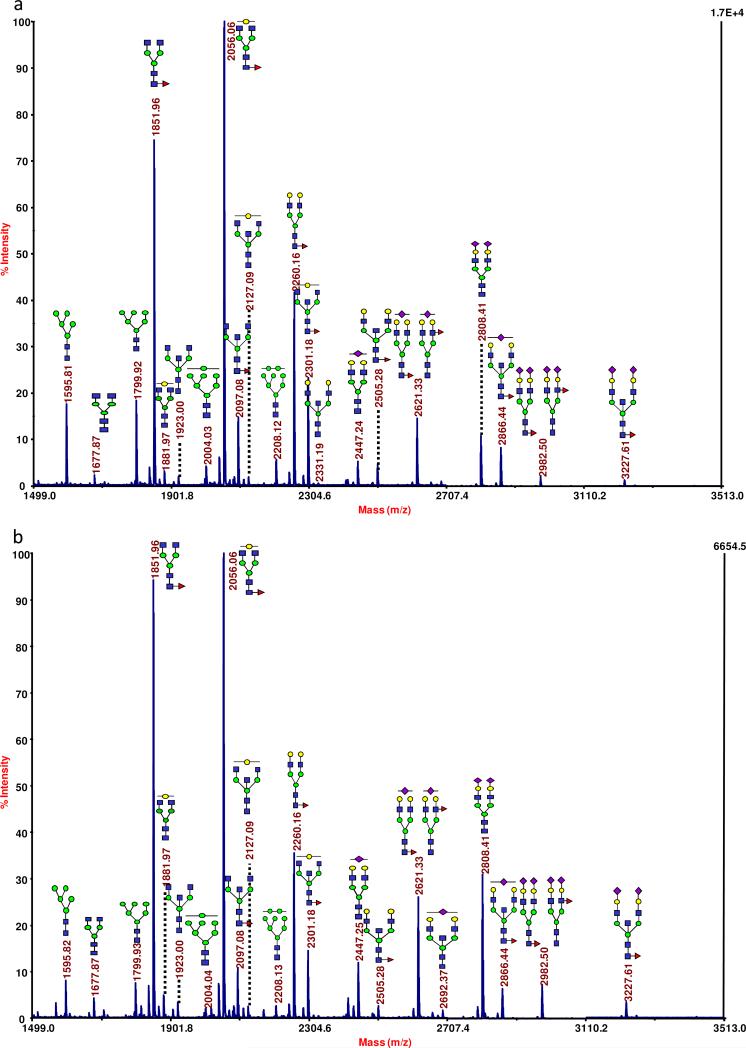
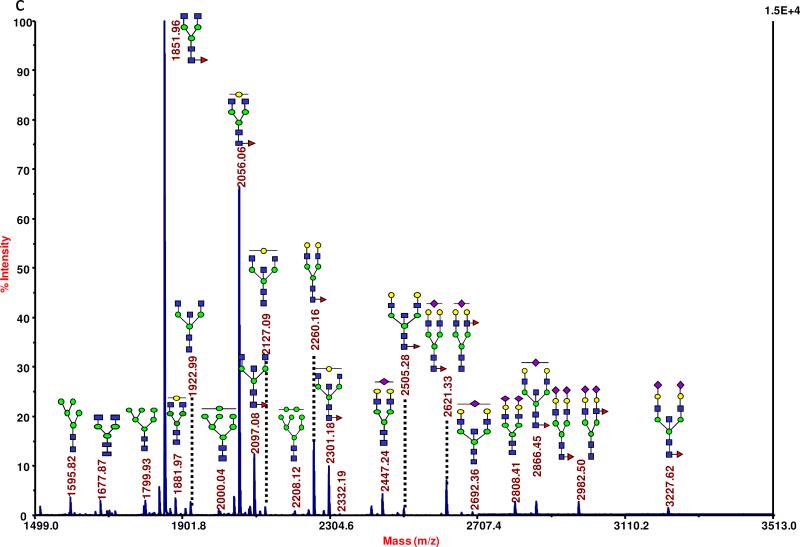
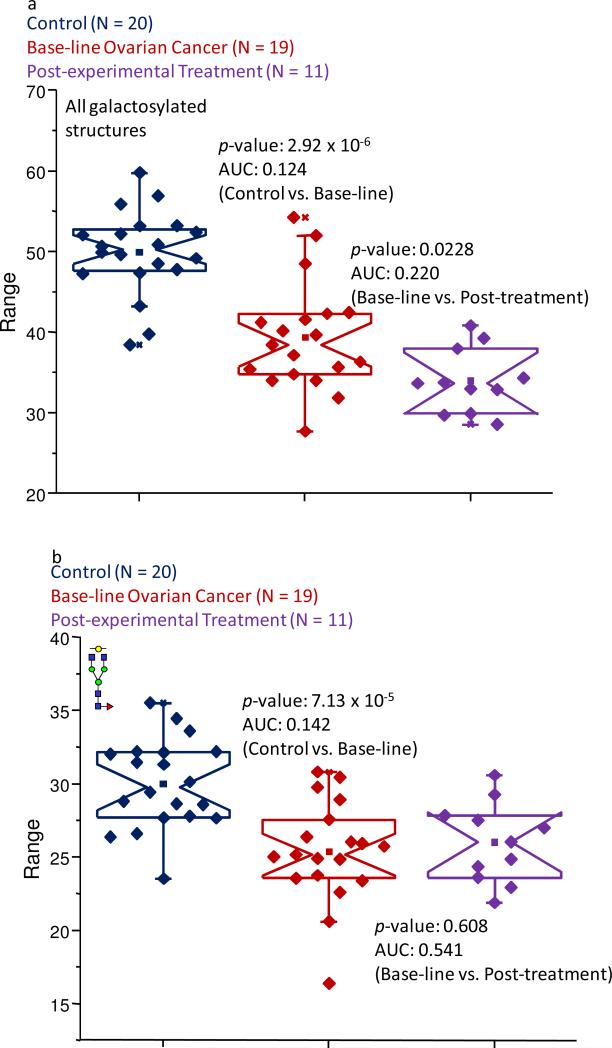
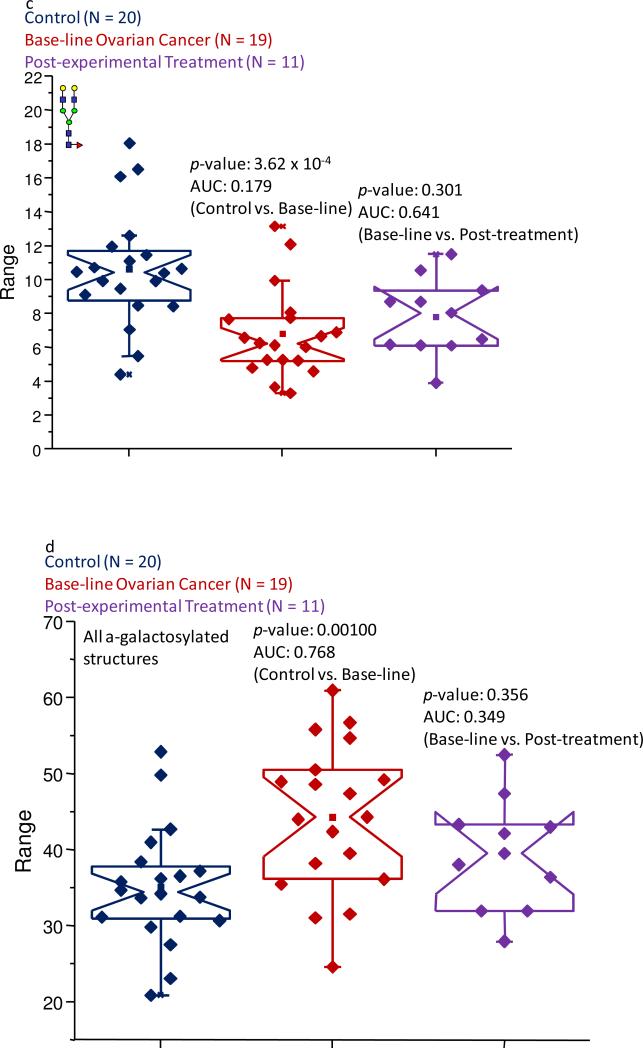
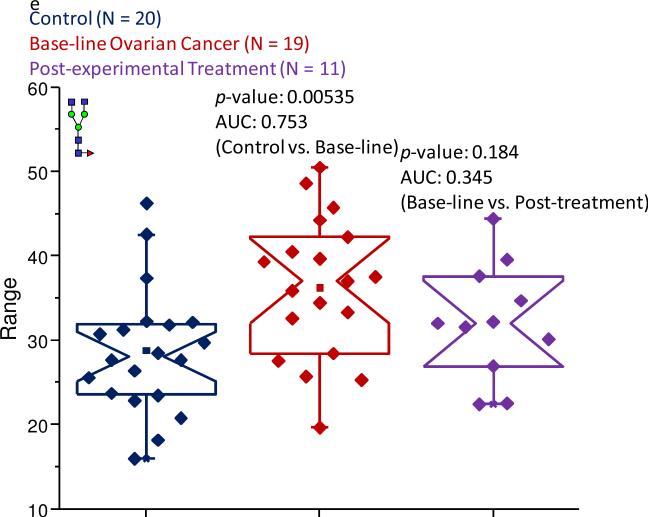
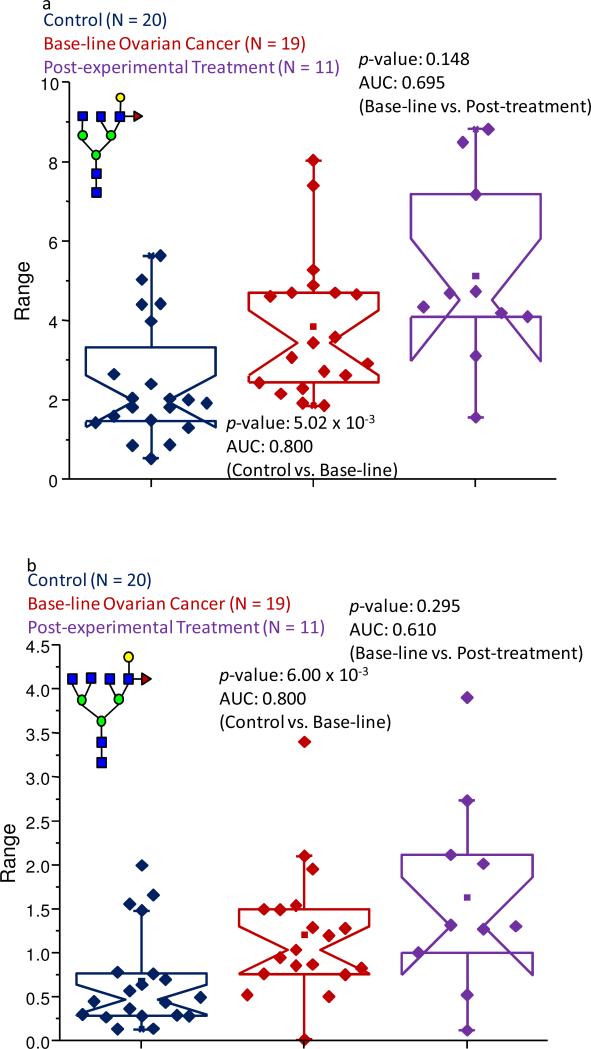
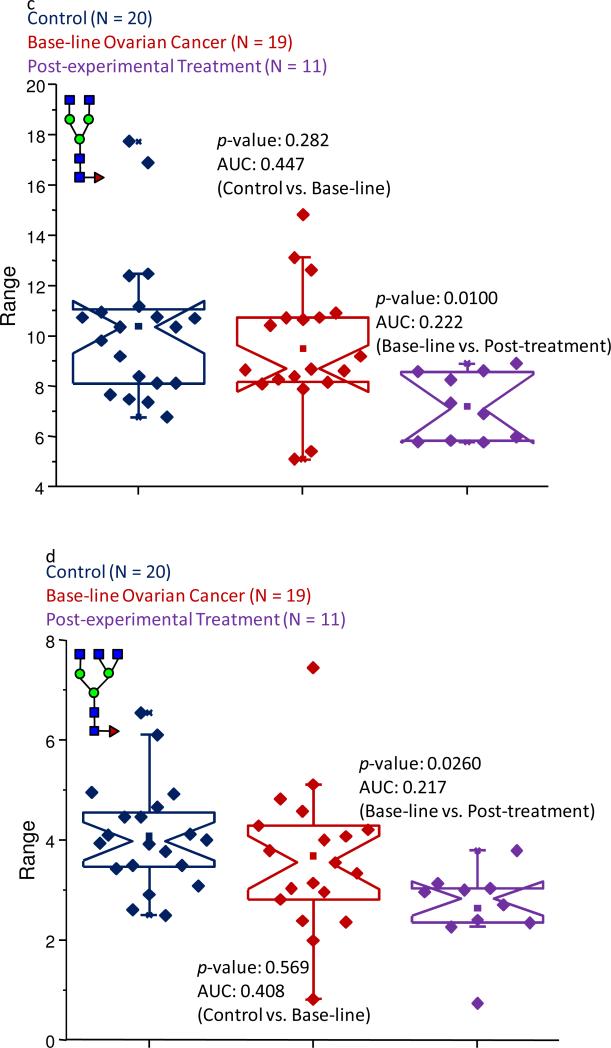
Glycosylated proteins play important roles in a broad spectrum of biochemical and biological processes, and prior reports have suggested that changes in protein glycosylation occur during cancer initiation and progression. Ovarian cancer (OC) is a fatal malignancy, most commonly diagnosed after the development of metastases. Therefore, early detection of OC is key to improving survival. To this end, specific changes of the serum glycome have been proposed as possible biomarkers for different types of cancers. In this study, we extend this concept to OC. To characterize differences in total N-glycan levels, serum samples provided by 20 healthy control women were compared to those acquired from patients diagnosed with late-stage recurrent OC who were enrolled in an experimental treatment trial prior to receiving therapy (N=19) and one month later, prior to the second treatment cycle (N=11). Additionally, analyses of the N-glycans associated with IgG and characterization of the relative abundance levels of core vs outer-arm fucosylation were also performed. The N-linked glycomic profiles revealed increased abundances of tri- and tetra-branched structures with varying degrees of sialylation and fucosylation and an apparent decrease in the levels of "bisecting" glycans in OC samples compared to controls. Increased levels of a-galactosylation structures were observed on N-linked glycans derived from IgG, which were independent of the presence of fucose residues. Elevated levels of outer-arm fucosylation were also identified in the OC samples. These results allowed the control samples to be distinguished from the baseline ovarian cancer patients prior to receiving the experimental treatment. In some cases, the pre-treatment samples could be distinguished from the post-experimental treatment samples, as many of those patients showed a further progression of the disease.


Figures

Figure 1
Figure 1
A representative MALDI MS-based N-linked profile acquired for (a) a control individual, the high-mass region of the spectrum collected for a control individual is shown as the inset; (b) a baseline ovarian cancer patient, the inset depicts the high-mass region of the spectrum. Symbols: blue square, N-acetylglucosamine; green circle, mannose; yellow circle, galactose; purple diamond, N-acetylneuraminic acid; red triangle, fucose.
Figure 2
Figure 2
Notched-box plots depicting changes in the relative abundances of (a) the bisecting subclass of glycans; (b) the fucosylated and sialylated oligosaccharide subclass; (c) the tri-antennary subclass of carbohydrates; and (d) the tetra-antennary subclass of structures for the control samples, baseline ovarian cancer samples, and the post-experimental treatment cohort. The symbols are the same as those described in Figure 1.
Figure 2
Figure 2
Notched-box plots depicting changes in the relative abundances of (a) the bisecting subclass of glycans; (b) the fucosylated and sialylated oligosaccharide subclass; (c) the tri-antennary subclass of carbohydrates; and (d) the tetra-antennary subclass of structures for the control samples, baseline ovarian cancer samples, and the post-experimental treatment cohort. The symbols are the same as those described in Figure 1.
Figure 3
Figure 3
Notched-box plots showing the relative abundances of (a) the tri-sialylated tri-antennary structure (observed at an m/z value of 3618.82); and (b) the fucosylated tri-sialylated tri-antennary oligosaccharide (observed at an m/z value of 3792.91). The symbols are the same as those described in Figure 1.
Figure 4
Figure 4
Notched-box plots showing the relative abundances of (a) the tetra-sialylated tetra antennary structure (observed at an m/z value of 4429.22); and (b) the fucosylated tetra-sialylated tetra-antennary oligosaccharide (observed at an m/z value of 4603.32). The symbols are the same as those described in Figure 1.
Figure 5
Figure 5
Representative MALDI MS-based profiles of IgG-associated glycans collected for (a) a control individual; (b) a baseline ovarian cancer sample; and (c) a post-experimental treatment sample. The symbols are the same as those described in Figure 1.
Figure 5
Figure 5
Representative MALDI MS-based profiles of IgG-associated glycans collected for (a) a control individual; (b) a baseline ovarian cancer sample; and (c) a post-experimental treatment sample. The symbols are the same as those described in Figure 1.
Figure 6
Figure 6
Notched-box plots demonstrating (a) the overall decreased abundance of galactosylated structures in the baseline ovarian cancer and post-experimental treatment sample sets; (b) the decreased abundance of the mono-galactosylated biantennary structure due to the pathological condition; (c) the decrease level of the di-galactosylated glycan in the disease samples; (d) the increased abundance of the a-galactosylated structures in the pathological samples; and (d) the increased level of the core-fucosylated, a-galactosylated bi-antennary structure in the samples associated with the baseline ovarian cancer samples and the post-experimental treatment set. All of these subclasses and structures were derived from IgG. The symbols are the same as those described in Figure 1.
Figure 6
Figure 6
Notched-box plots demonstrating (a) the overall decreased abundance of galactosylated structures in the baseline ovarian cancer and post-experimental treatment sample sets; (b) the decreased abundance of the mono-galactosylated biantennary structure due to the pathological condition; (c) the decrease level of the di-galactosylated glycan in the disease samples; (d) the increased abundance of the a-galactosylated structures in the pathological samples; and (d) the increased level of the core-fucosylated, a-galactosylated bi-antennary structure in the samples associated with the baseline ovarian cancer samples and the post-experimental treatment set. All of these subclasses and structures were derived from IgG. The symbols are the same as those described in Figure 1.
Figure 7
Figure 7
Notched-box plots presenting changes in abundance levels of structures generated by the exoglycosidase digestion of glycans using a non-specific sialidase and a β1-4,6 galactosidase. The increased levels of outer-arm fucosylation are shown in (a) for the tri-antennary digestion product; and (b) for the tetra-antennary structure. Decreased levels of core fucosylation in the post-experimental treatment samples were observed for (c) the bi-antennary product; and (d) the tri-antennary structure. The symbols are the same as those described in Figure 1.
Figure 7
Figure 7
Notched-box plots presenting changes in abundance levels of structures generated by the exoglycosidase digestion of glycans using a non-specific sialidase and a β1-4,6 galactosidase. The increased levels of outer-arm fucosylation are shown in (a) for the tri-antennary digestion product; and (b) for the tetra-antennary structure. Decreased levels of core fucosylation in the post-experimental treatment samples were observed for (c) the bi-antennary product; and (d) the tri-antennary structure. The symbols are the same as those described in Figure 1.

Similar articles

Cited by

References

    1. Dube DH, Bertozzi CR. Glycans in cancer and inflammation--potential for therapeutics and diagnostics. Nat. Rev. Drug Discov. 2005;4:477–88. - PubMed
    1. Varki A. Biological roles of oligosaccharides: all of the theories are correct. Glycobiology. 1993;3:97–130. - PMC - PubMed
    1. Ohtsubo K, Marth JD. Glycosylation in cellular mechanisms of health and disease. Cell. 2006;126:855–67. - PubMed
    1. Arnold JN, Saldova R, Hamid UM, Rudd PM. Evaluation of the serum N-linked glycome for the diagnosis of cancer and chronic inflammation. Proteomics. 2008;8:3284–93. - PubMed
    1. Pan S, Chen R, Aebersold R, Brentnall TA. Mass spectrometry based glycoproteomics--from a proteomics perspective. Mol. Cell. Proteomics. 2011;10:R110 003251. - PMC - PubMed

Publication types

MeSH terms