. 2012 Feb 3;148(3):502-14.
doi: 10.1016/j.cell.2012.01.007.

Cortical dynein controls microtubule dynamics to generate pulling forces that position microtubule asters

Affiliations

Cortical dynein controls microtubule dynamics to generate pulling forces that position microtubule asters

Liedewij Laan et al. Cell. .

Abstract

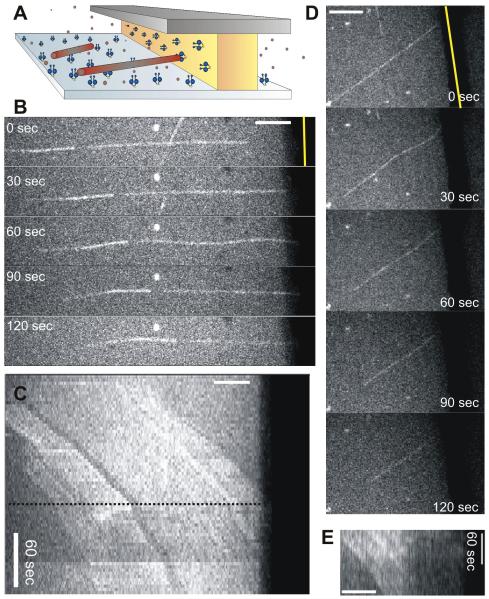
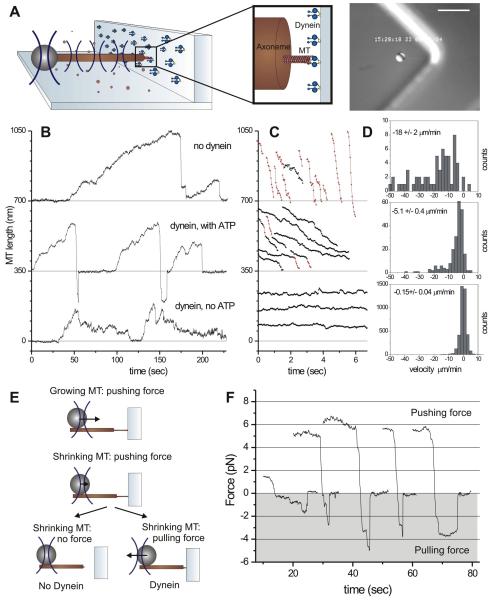
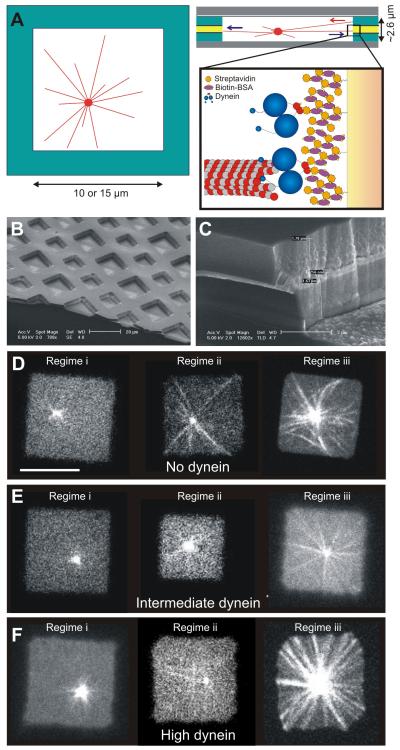
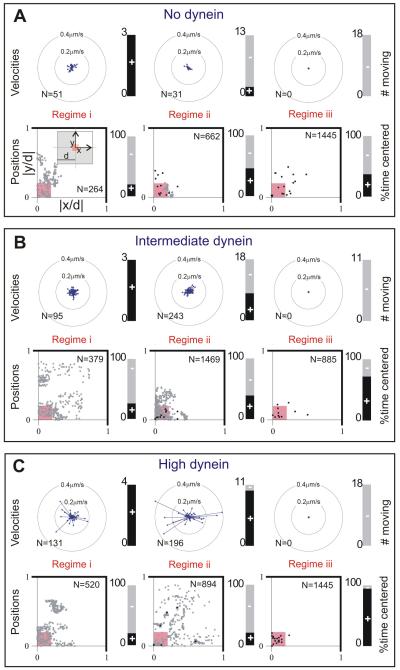
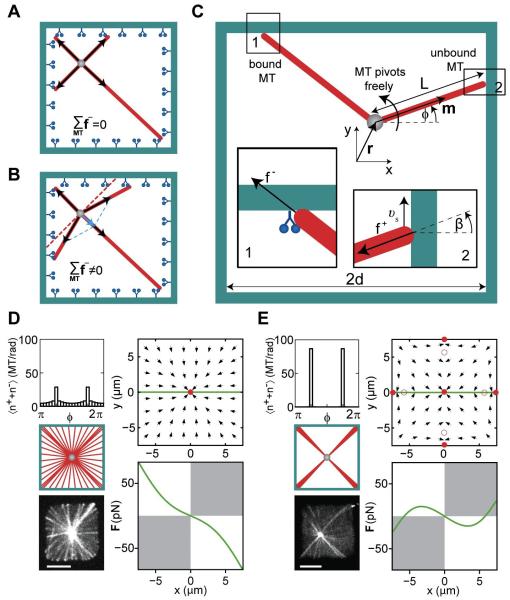
Dynein at the cortex contributes to microtubule-based positioning processes such as spindle positioning during embryonic cell division and centrosome positioning during fibroblast migration. To investigate how cortical dynein interacts with microtubule ends to generate force and how this functional association impacts positioning, we have reconstituted the 'cortical' interaction between dynein and dynamic microtubule ends in an in vitro system using microfabricated barriers. We show that barrier-attached dynein captures microtubule ends, inhibits growth, and triggers microtubule catastrophes, thereby controlling microtubule length. The subsequent interaction with shrinking microtubule ends generates pulling forces up to several pN. By combining experiments in microchambers with a theoretical description of aster mechanics, we show that dynein-mediated pulling forces lead to the reliable centering of microtubule asters in simple confining geometries. Our results demonstrate the intrinsic ability of cortical microtubule-dynein interactions to regulate microtubule dynamics and drive positioning processes in living cells.


Figures

Figure 1
Figure 1. Cortical dynein captures dynamic MT ends
(A) End-on MT-dynein contacts during spindle positioning in C. elegans embryos. (B) Schematic view of the reconstituted interaction between dynamic MT ends and ‘cortical’ dynein. (C,D) Spinning disc confocal fluorescence images of MTs interacting with a barrier without (C; Movie S1) and with (D; Movie S2) dynein (using the multilayer). Yellow line indicates the position of the barrier. Scale bar indicates 5 μm. (E,F) MTs growing against barriers coated with 100% dynein without (E; Movie S3) and with (F) use of the multilayer. Scale bars indicate 10 μm. (G) Numbers of straight (stalled) and buckled (growing) MTs observed, and numbers of observed release and catastrophe events for various dynein densities (0% refers to no dynein, Multi refers to the use of a multilayer as in D). See Figure S1 for details on the detection of buckled MTs. (H) Release (straight MTs) and catastrophe (buckled MTs) frequencies for the various conditions. Error bars give the statistical errors based on the number of observed events. For cases with fewer than 6 events only an upper limit corresponding to a 95% confidence interval is shown.
Figure 2
Figure 2. Barrier-attached dynein triggers catastrophes and slows down MT shrinkage
(A) Schematic view of the gliding experiment. (B) MT gliding with its plus-end against a barrier (Movie S4). (C) Kymograph of the same MT. The MT hits the barrier at the dotted line. MT speckles show that the MT undergoes a catastrophe and continues gliding while shrinking. (D) Another gliding MT showing similar behavior. (E) Accompanying kymograph, where only the left half of the MT can be seen due to buckling. Scale bars indicate 5 μm.
Figure 3
Figure 3. Barrier-attached dynein pulls on shrinking MT ends
(A) Schematic view of the optical trap experiment. Detail is roughly drawn to scale. Image shows a DIC snapshot of the experiment. Scale bar indicates 10 μm. (B) Growth and shrinkage of MTs interacting with an uncoated barrier (upper trace), and with a dynein-coated barrier in the presence (middle trace) and absence (lower trace) of ATP. (C) Shrinkage events of the three experiments. Shrinkage intervals with a velocity higher/lower than 10 μm/min (measured over 120 ms) are indicated in red/black. (D) Histograms and average values (± SE) of all 120-ms shrinking velocities (see also Table S1). (E) Schematic of forces experienced by dynamic MT ends. (F) Shrinkage events resulting in the generation of a pulling force (shaded in grey).
Figure 4
Figure 4. The positioning of MT asters in microfabricated chambers
(A) Schematic picture of a dynamic MT aster confined in a microfabricated chamber. Detail shows the attachment of dynein molecules via a multilayer of streptavidin and biotin-BSA (roughly to scale). (B) Scanning electron microscope (SEM) image of the microfabricated chambers. (C) SEM image of a sidewall. (D,E,F) Single plane spinning disk confocal fluorescence images for no dynein (D), intermediate dynein amounts (E), and high dynein amounts (F) on the walls. In regime (i), the average MT length is short, in regime (ii) it is similar, and in regime (iii) it is long compared to the chamber size 2d. Scale bar indicates 10 μm. In each regime, asters were followed for 60 - 600 sec with 3 sec time intervals.
Figure 5
Figure 5. MT aster positions and movements
(A,B,C) Data are shown for the same conditions and regimes as displayed in Figure 4DEF. Top: rosette plots show the magnitude and the direction of velocity of all moving centrosomes. The velocity was determined over 15 s time intervals. The directions are binned into 16 angles. The lengths of the arrows indicate the average velocity in that direction for all time intervals, where N is the total number of time intervals per condition. The stacked bar plots show the number of centrosomes that moved (black, +). Bottom: scatter plots of all aster positions, normalized with d, plotted in one quadrant of the chamber, as indicated in the left-most plot in A (N is the total number of time points, n the number of asters). Aster positions within the small pink square are considered centered. Grey dot indicates one time point; black point indicates more than 10 time points at the same position. Mean positions and standard deviations are given in Table S2. The stacked bar plots show the percentage of time that centrosomes were centered (black, +).
Figure 6
Figure 6. Theory of aster positioning
Cartoon showing the net pulling force without (A) and with MT slipping (B). (C) Schematic representation of a MT organizing center at r=(x,y) in a confining geometry. The MT orientation is described by the angle φ, the MT length is denoted by L. Inset 1 shows a MT under pulling force f. Inset 2 shows a MT under pushing force f+, which slips along the wall with velocity νs. The angle between the MT orientation and the normal to the boundary is β. (D,E) Angular MT distributions and the corresponding force direction fields for a MT organizing center in a chamber with (D; kb=0.02 s−1) and without dynein (E; kb =0 s−1). Full and hollow red circles show the stable and unstable force-balanced states, and the green line indicates the positions for which the forces are shown below. White quadrants indicate where the force is centering. Other parameters (see Box 1) are kcat = 10−4 s−1, koff = 10−3 s−1, = 5 pN, ζ = 5·10−5 N·s/m, κ = 3.3·10−23 Nm2, M=50. For comparison, images of a MT aster in a microfabricated chamber with (D), and without dynein (E) are shown. Scalebars indicate 5 μm.

References

    1. Adames NR, Cooper JA. Microtubule interactions with the cell cortex causing nuclear movements in Saccharomyces cerevisiae. J Cell Biol. 2000;149:863–874. - PMC - PubMed
    1. Akiyoshi B, Sarangapani KK, Powers AF, Nelson CR, Reichow SL, Arellano-Santoyo H, Gonen T, Ranish JA, Asbury CL, Biggins S. Tension directly stabilizes reconstituted kinetochore-microtubule attachments. Nature. 2010;468:576–579. - PMC - PubMed
    1. Burakov A, Nadezhdina E, Slepchenko B, Rodionov V. Centrosome positioning in interphase cells. J Cell Biol. 2003;162:963–969. - PMC - PubMed
    1. Carminati JL, Stearns T. Microtubules orient the mitotic spindle in yeast through dynein-dependent interactions with the cell cortex. J Cell Biol. 1997;138:629–641. - PMC - PubMed
    1. Chang F, Nurse P. How fission yeast fission in the middle. Cell. 1996;84:191–194. - PubMed

Publication types

MeSH terms

Substances