

Generalizability of epidemiological findings and public health decisions: an illustration from the Rochester Epidemiology Project
- PMID: 22305027
- PMCID: PMC3538404
- DOI: 10.1016/j.mayocp.2011.11.009
Generalizability of epidemiological findings and public health decisions: an illustration from the Rochester Epidemiology Project
Abstract
Objective: To illustrate the problem of generalizability of epidemiological findings derived from a single population using data from the Rochester Epidemiology Project and from the US Census.
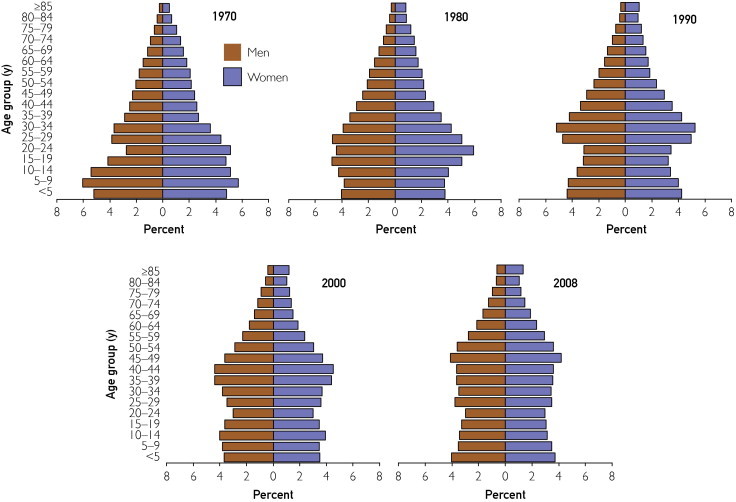
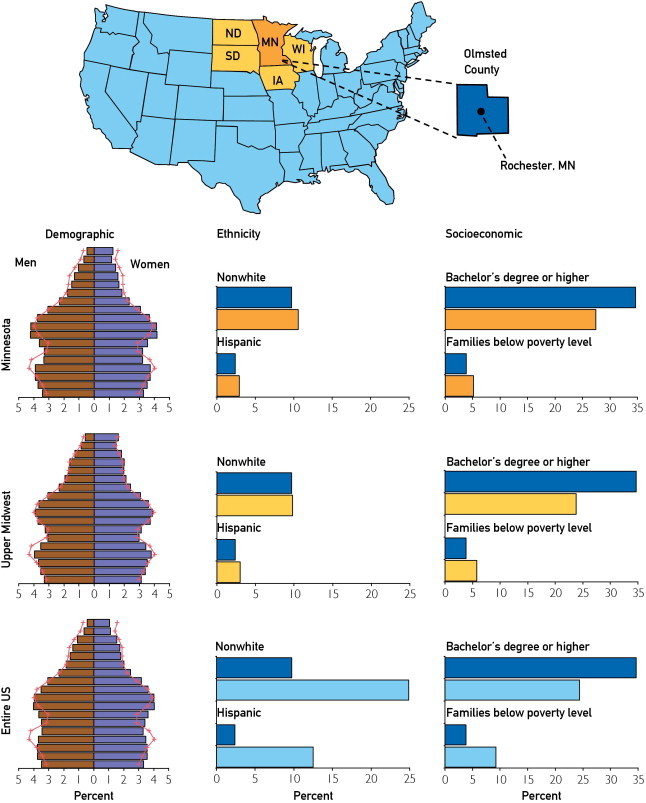
Methods: We compared the characteristics of the Olmsted County, Minnesota, population with the characteristics of populations residing in the state of Minnesota, the Upper Midwest, and the entire United States.
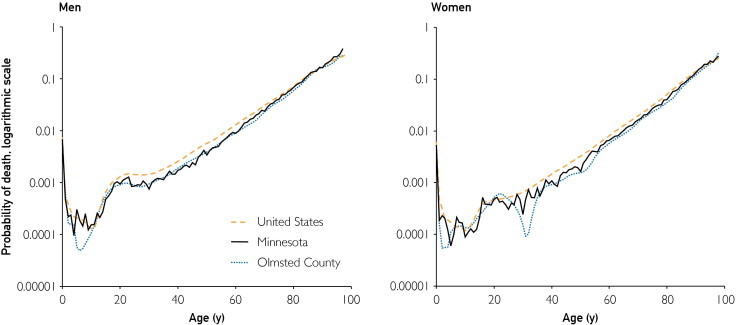
Results: Age, sex, and ethnic characteristics of Olmsted County were similar to those of the state of Minnesota and the Upper Midwest from 1970 to 2000. However, Olmsted County was less ethnically diverse than the entire US population (90.3% vs 75.1% white), more highly educated (91.1% vs 80.4% high school graduates), and wealthier ($51,316 vs $41,994 median household income; 2000 US Census data). Age- and sex-specific mortality rates were similar for Olmsted County, the state of Minnesota, and the entire United States.
Conclusion: We provide an example of analyses and comparisons that may guide the generalization of epidemiological findings from a single population to other populations or to the entire United States.
Copyright © 2012 Mayo Foundation for Medical Education and Research. Published by Elsevier Inc. All rights reserved.
Figures
References
-
- Anderson D.W., Mantel N. On epidemiologic surveys. Am J Epidemiol. 1983;118(5):613–619. - PubMed
-
- Deming W.E. On the use of judgment-samples. Rep Statist Applications. 1976;23:25–31.
-
- Weiss N.S., Koepsell T.D., Psaty B.M. Generalizability of the results of randomized trials. Arch Intern Med. 2008;168(2):133–135. - PubMed
-
- Plan and operation of the Third National Health and Nutrition Examination Survey, 1988-94: Series 1: Programs and collection procedures. Vital Health Stat 1. 1994;(32):1–407. - PubMed
-
- Melton L.J., III History of the Rochester Epidemiology Project. Mayo Clin Proc. 1996;71(3):266–274. - PubMed
Publication types
MeSH terms
Grants and funding
LinkOut - more resources
Full Text Sources
Medical
