Review
. 2012 Mar;23(3):142-53.
doi: 10.1016/j.tem.2011.12.008. Epub 2012 Feb 2.

Linking mitochondrial bioenergetics to insulin resistance via redox biology

Affiliations
Review

Linking mitochondrial bioenergetics to insulin resistance via redox biology

Kelsey H Fisher-Wellman et al. Trends Endocrinol Metab. 2012 Mar.

Abstract

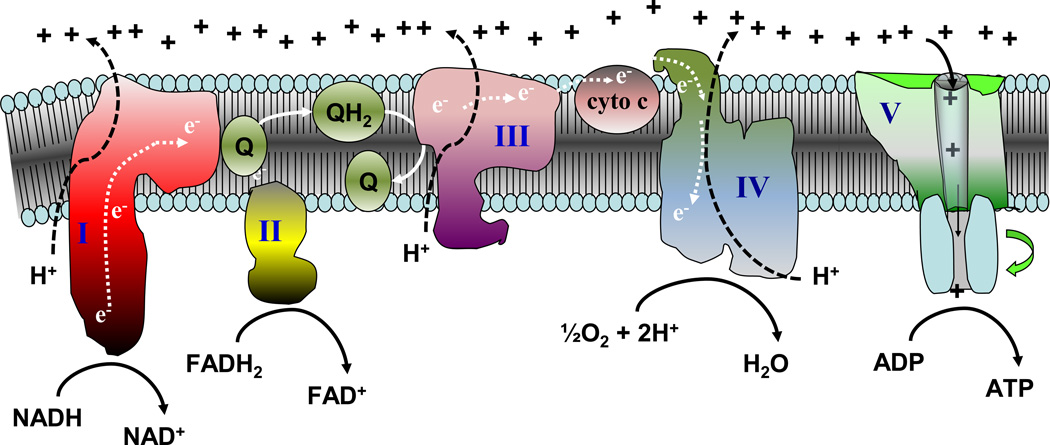
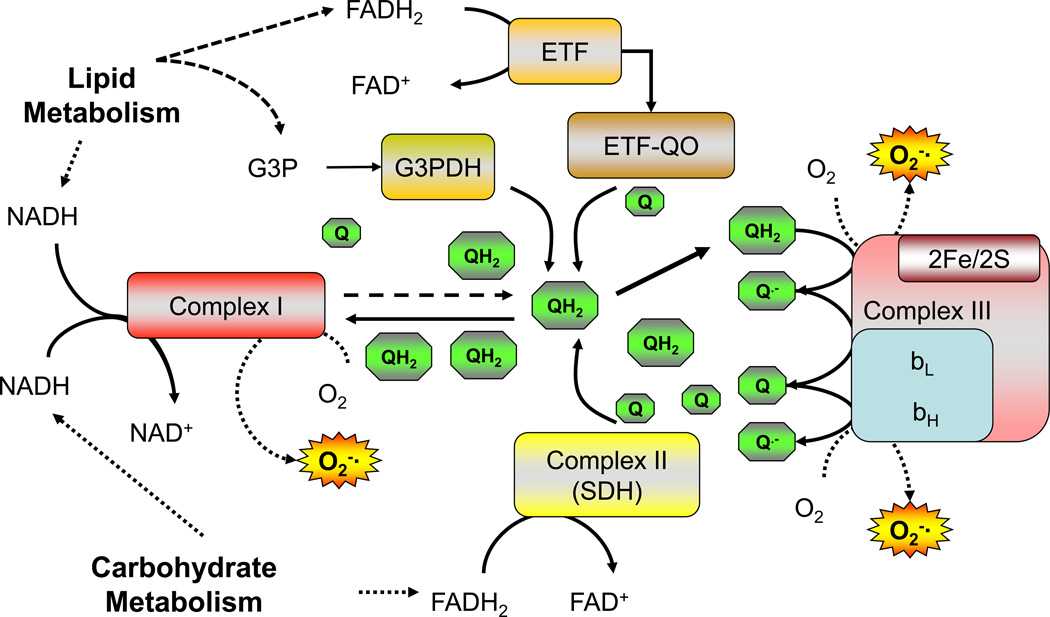
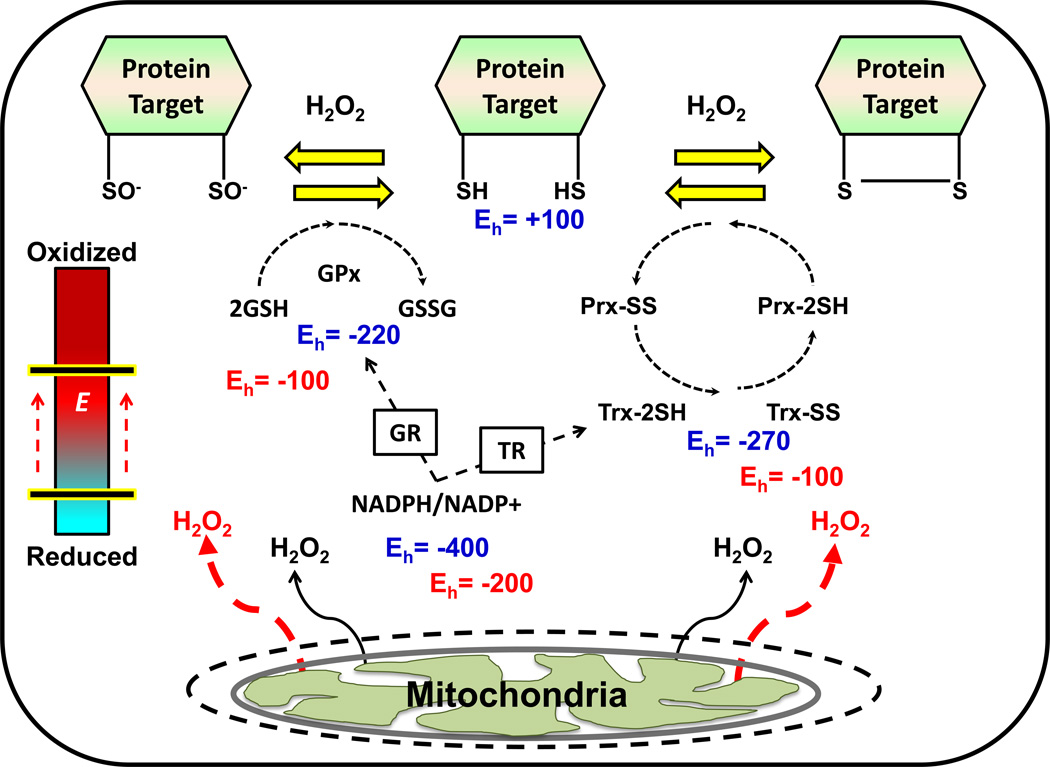
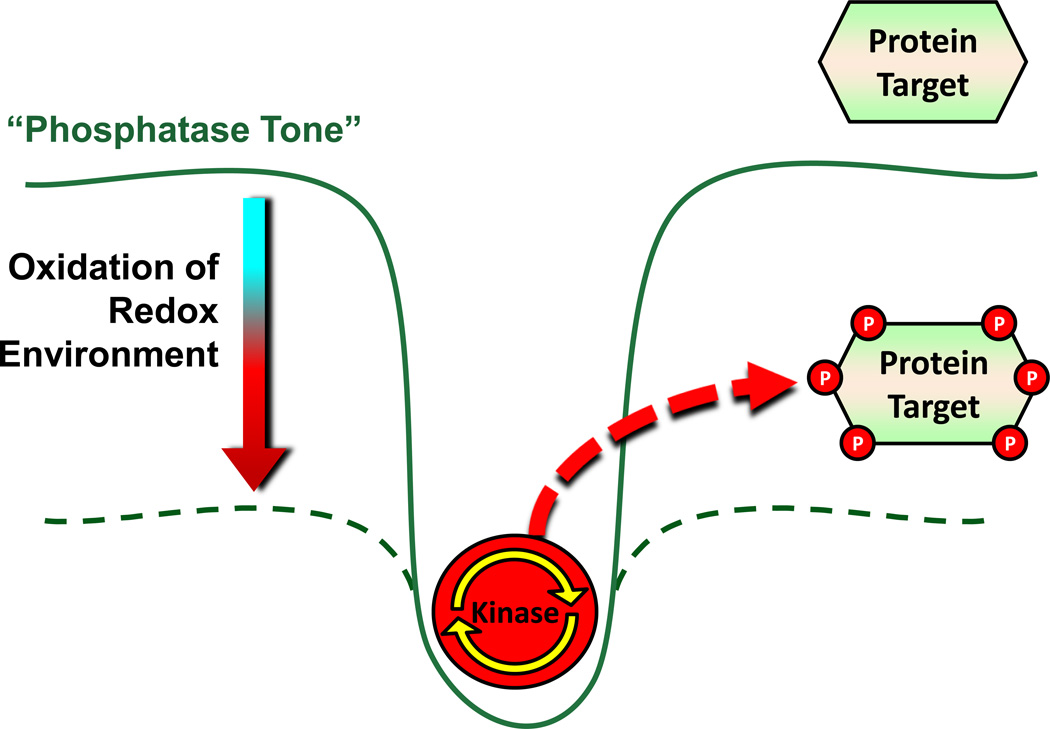
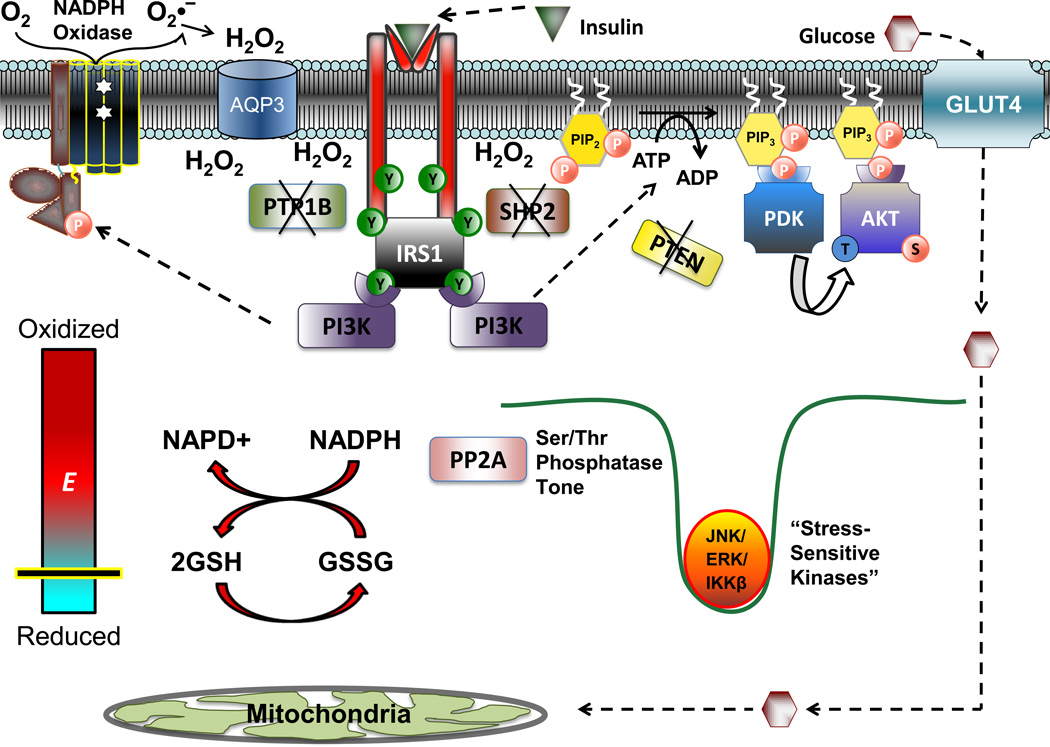
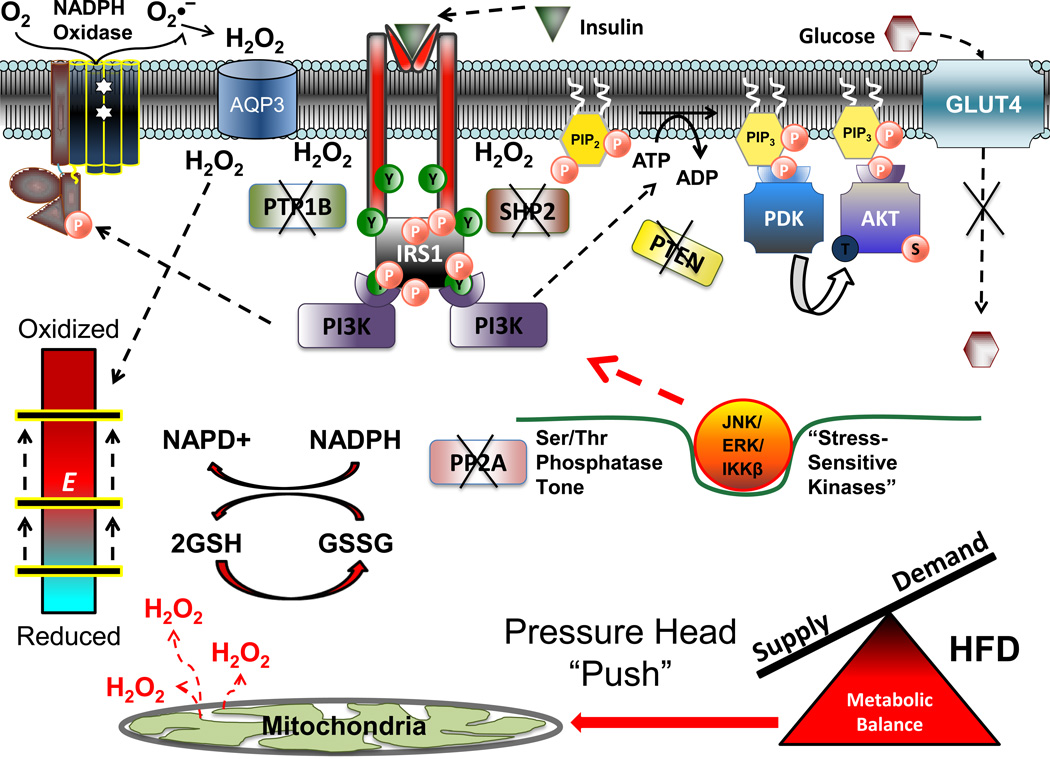
Chronic overnutrition and physical inactivity are major risk factors for insulin resistance and type 2 diabetes. Recent research indicates that overnutrition generates an increase in hydrogen peroxide (H(2)O(2)) emission from mitochondria, serving as a release valve to relieve the reducing pressure created by fuel overload, as well as a primary signal that ultimately decreases insulin sensitivity. H(2)O(2) is a major input to cellular redox circuits that link to cysteine residues throughout the entire proteome to regulate cell function. Here we review the principles of mitochondrial bioenergetics and redox systems biology and offer new insight into how H(2)O(2) emission may be linked via redox biology to the etiology of insulin resistance.


Figures

Figure 1
Figure 1. Schematic depiction of the mitochondrial electron transport system
Reducing equivalents (NADH, FADH2) provide electrons that flow through complex I, the ubiquinone cycle (Q/QH2), complex III, cytochrome c, complex IV, and to the final acceptor O2 to form water. Electron flow through complexes I, III, and IV results in pumping of protons to the outer surface of the inner membrane, establishing a membrane potential that is used by the ATP synthase to drive the rephosphorylation of ADP. Animated versions depicting the bioenergetics governing the system are provided in the online version of the figure.
Figure 2
Figure 2. Schematic showing electron flow into the ubiquinone (Q) pool
High rates of electron flux into the Q pool from lipid metabolism are proposed to increase O2 generation at complex I due to decreased availability of oxidized Q and/or reverse electron flux from reduced Q (QH2) back into complex I. ETF, electron737 transferring flavoprotein; ETF-QO, electron-transferring flavoprotein dehydrogenase; G3PDH, glycerol-3-phosphate dehydrogenase.
Figure 3
Figure 3. Simplified model of redox circuitry
Theoretical Eh values are shown in blue for the 2GSH/GSSG, Trx2SH/TrxSS, and NADPH/NADP+ redox couples, as well as their protein target. Electrons flow through the circuit from the NADPH/NADP+ couple to thiol (SH) moieties within exposed Cys. The overall driving force for reduction is determined by the mV differences in Eh between NADPH/NADP+ and the redox sensitive Cys- containing proteins (e.g., ΔEh = −500 mV). The red text indicates the effects of a transient increase in mitochondrial H2O2 emission in the context of a redox mediated signaling event. Under these conditions, an oxidative shift in the redox environment (depicted as a positive shift in each couple’s Eh), would reduce the overall driving force for the reduction of exposed Cys residues within the target protein (ΔEh = −300 mV), thereby altering the redox state of the protein in favor of its oxidized form (e.g., either 2SO or SS) and leading to a cellular response. These responses are thought to function as a means of rheostat regulation rather than as a simple “on/off” mechanism. The blue/red bar on the left labeled “E” represents the intracellular redox environment. GR, glutathione reductase; TR, thioredoxin reductase; Gpx, glutathione peroxidase; Prx, peroxiredoxin.
Figure 4
Figure 4. Role of the redox environment in the establishment of “phosphatase tone”
Under the normal reducing conditions of the intracellular redox environment, phosphatase tone is elevated, ensuring that net kinase activity is suppressed and specific protein targets are dephosphorylated. In response to an oxidative shift in the redox environment, phosphatase tone is lowered to a level which allows for kinase activity to dominate and thus leads to phosphorylation of target proteins. Figure adapted from Wright et al. [37].
Figure 5
Figure 5. Proposed alterations in cell redox as a necessary component of insulin signaling
In the absence of insulin, the principle nodes of regulation within the insulin signaling cascade are kept dephosphorylated via the membrane associated proteins PTP1B, SHP2, and PTEN. Following insulin binding and Tyr-phosphorylation of the insulin receptor and IRS1, the activation of membrane bound NADPH oxidase (potentially mediated by PI3K) results in the accumulation of H2O2 at the level of the plasma membrane to transiently inactivate PTP1B, SHP2 and PTEN, thus allowing propagation of kinase-mediated signaling, leading to GLUT4 translocation and glucose uptake. While the local redox environment at the plasma membrane, and redox sensitive proteins in direct proximity to the H2O2 source undergo an oxidative shift, the global redox state of the cell is maintained by the redox buffering systems(depicted by the thick red arrows illustrating the reaction between the 2GSH/GSSG and NADPH/NADP+couples). Maintenance of global redox ensures that Ser/Thr phosphatase activity, specifically PP2A (and potentially MKP and PP1, not shown), are maintained. The continued activation of these enzymes ensures that certain Ser/Thr kinases (JNK, ERK, IKKβ) remain inactive and that phosphomoieties are not allowed to accumulate within insulin signaling proteins.
Figure 6
Figure 6. Proposed model of high fat diet-induced insulin resistance
Chronic elevations in mitochondrial H2O2 emission as a result of a high fat diet serve to reduce the reserve capacity within the redox buffering systems and induce an oxidative shift in the cellular redox environment (bar shifted up to beginning of red zone on redox environment gauge). This global shift in cell redox may be sufficient to inactivate cellular Ser/Thr phosphatase (PP2A) activity, in turn promoting activation of stress-sensitive Ser/Thr kinases (JNK, ERK, IKKβ) and accumulation of inhibitory phosphomoieties within various insulin signaling proteins. Alternatively, the oxidative shift in global redox environment induced by the high fat diet may compromise the capacity of the redox buffering systems to buffer the H2O2 production from membrane bound NADPH oxidase in response to insulin, resulting in a further shift in global redox environment that is sufficient to inactivate both PTP and Ser/Thr phosphatases, all of which decreases signal propagation throughout the cascade and impairs glucose uptake.
Figure 7
Figure 7. Potential dynamic alterations in insulin sensitivity and redox environment as a function of metabolic balance over time
Frequent intake of energy dense meals in conjunction with a sedentary lifestyle promotes acute and persistent fluctuations, positive metabolic balance, as well as concomitant shifts in both the redox environment and insulin sensitivity. Summation of these acute fluctuations over an extended period of time (1 week) result in a gradual shift in baseline levels for redox environment and insulin sensitivity, as well as exacerbated shifts in response to meal challenges, ultimately leading to relative insulin resistant state.

References

    1. Lowell BB, Shulman GI. Mitochondrial dysfunction and type 2 diabetes. Science. 2005;307:384–387. - PubMed
    1. Muoio DM, Neufer PD. Lipid-induced mitochondrial stress and insulin resistance. Cell Metabolism. ((in press)) Invited Perspective. - PMC - PubMed
    1. Mitchell P. Coupling of phosphorylation to electron and hydrogen transfer by a chemi-osmotic type of mechanism. Nature. 1961;191:144–148. - PubMed
    1. Korshunov SS, et al. High protonic potential actuates a mechanism of production of reactive oxygen species in mitochondria. FEBS Lett. 1997;416:15–18. - PubMed
    1. Liu SS. Generating, partitioning, targeting and functioning of superoxide in mitochondria. Biosci Rep. 1997;17:259–272. - PubMed

Publication types

Substances